History of currency crises: The impossible trinity and early warning signals
This report by unpacks the mechanics of currency crises through the Impossible Trinity, highlighting how tensions between exchange rate stability, capital flows, and monetary policy create systemic vulnerabilities. Drawing lessons from the U.K. Black Wednesday 1992, the Asian Financial Crisis 1997, and the Russian Ruble Crisis 1998.
The history of the international monetary system is defined by periodic ŌĆ£breaking pointsŌĆØ at which currency values undergo rapid, nonlinear adjustments. For the institutional trader, these episodes represent the ultimate expression of the ŌĆ£Impossible Trinity,ŌĆØ where the friction between domestic policy and global capital mobility reaches a tipping point.
Understanding these historical patterns is essential for evaluating current market risks and identifying ŌĆ£regime breaksŌĆØ before they occur.
The strategic constraint: The ŌĆśImpossible TrinityŌĆÖ
At the core of every currency crisis is the principle of the Impossible Trinity (or the Trilemma). This macro constraint posits that a country cannot simultaneously achieve three specific goals.
- A fixed exchange rate: Stabilizing the currency value against a major anchor (e.g., the USD).
- Free capital mobility: Allowing money to move across borders without restrictions.
- Independent monetary policy: The ability to set domestic interest rates to manage growth and inflation.
When a government attempts to pursue all three, the ŌĆ£Impossible TrinityŌĆØ trade, it creates a structural imbalance. If capital is free to move, a country with a fixed peg must mirror the interest rates of the anchor currency.
Any attempt to deviate (e.g., cutting rates during a recession while the anchor keeps them high) triggers immediate capital flight, forcing a choice between a or the .
Macro backdrop: Three generations of structural failure
Currency crises typically follow one of three theoretical ŌĆ£blueprintsŌĆØ of collapse:
- Fiscal inconsistency (first generation): A classic ŌĆ£bad managementŌĆØ scenario where a government runs persistent budget deficits financed by printing money while trying to maintain a fixed peg. Speculators recognize that the central bankŌĆÖs reserves are an exhaustible resource and launch a pre-emptive attack.
- Policy trade-offs and expectations (second generation): A crisis can occur even with ŌĆ£fineŌĆØ fundamentals if the market doubts a governmentŌĆÖs will to defend a peg. If defending the currency (via high interest rates) causes too much domestic pain (e.g., unemployment), investors front-run the expected devaluation, making the cost of defence politically untenable.
- Financial fragility and maturity mismatches (third generation): Common in high-growth ŌĆ£miracleŌĆØ economies. This occurs when local banks and corporations borrow short-term in foreign currency (USD) to fund long-term domestic projects. A sudden stop in credit rolls leads to a liquidity squeeze, in which the resulting devaluation causes the local-currency value of the debt to skyrocket, triggering mass insolvency.
Historical lessons: A study in policy divergence and contagion
Below are three past significant currency crises and the respective spill-over contagion effects on the broader economy.
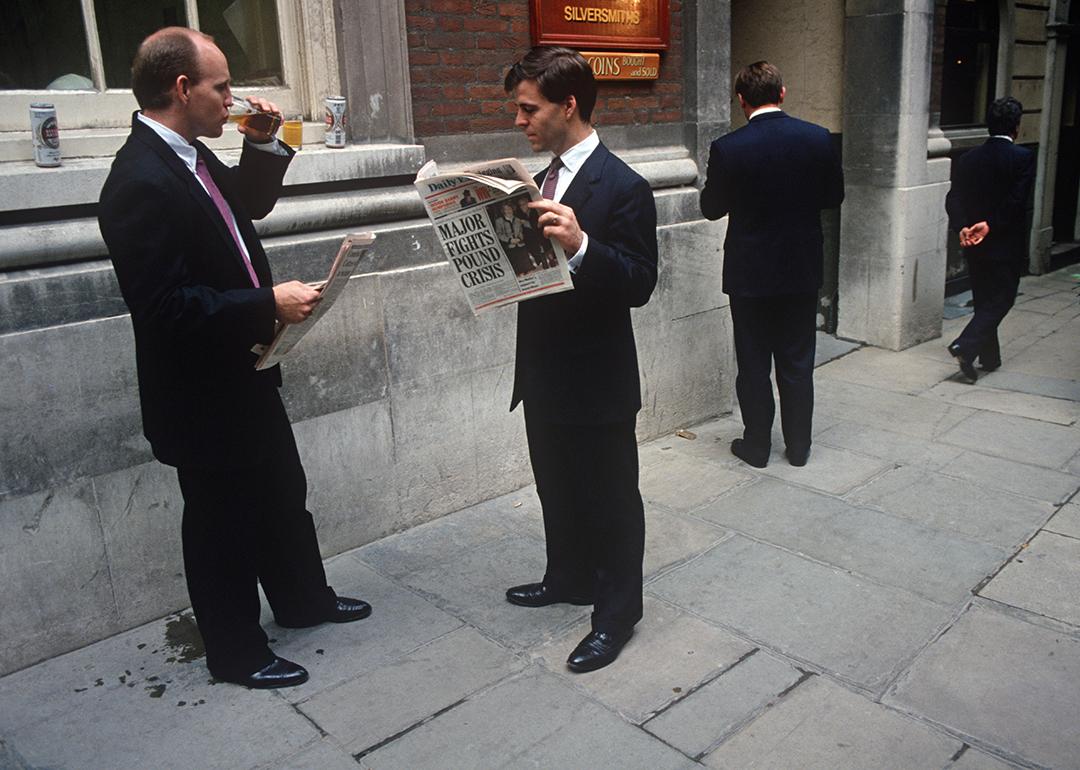
1. The 1992 U.K. ŌĆśBlack WednesdayŌĆÖ: The limit of political will
In 1992, the U.K. was tied to the European Exchange Rate Mechanism (ERM), requiring the pound to stay steady against the Deutsche mark. Germany hiked rates to combat reunification-driven inflation, while the U.K. was entering a recession and needed lower rates.
- The break: Speculators realized the U.K.ŌĆÖs commitment to high rates (10%) was unsustainable. In a desperate attempt to defend the floor, the to 12% and then 15% in a single day.
- The result: The market called the bluff. The U.K. spent nearly (30 billion pounds) in hours before suspending its ERM membership on Sept. 16, 1992.
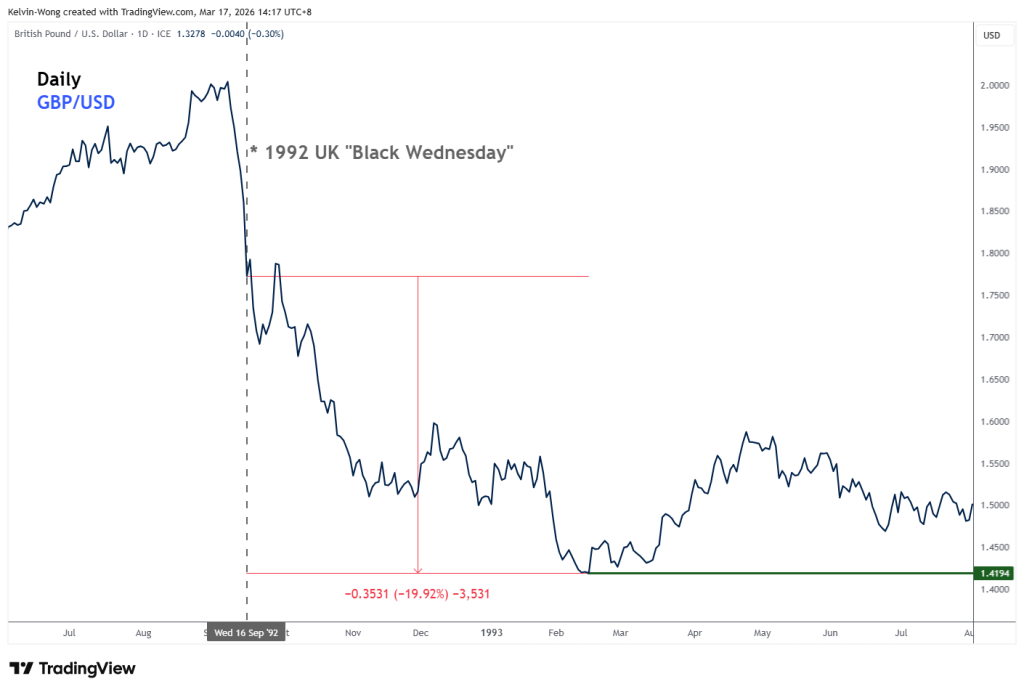
- The aftermath: The GBP/USD collapsed by close to 20% in the next five months before it stabilized at 1.4194 on Feb. 15, 1993 (see Fig. 1). Also, political humiliation for then Prime Minister John Major and Chancellor Norman Lamont, who faced a ŌĆ£humiliating defeat,ŌĆØ destroying the Conservative PartyŌĆÖs reputation for economic competence and directly in 1997.
2. The 1997 Asian financial crisis: A study in regional contagion
- The trigger: Thailand maintained a rigid peg of 25 baht to the dollar, encouraging massive, unhedged USD borrowing. As the USD appreciated against the Japanese yen, , and the current account deficit reached 8% of GDP.
- The fall: When the Bank of ThailandŌĆÖs forward position exhausted its reserves, the baht was floated on July 2, 1997, eventually losing over 50% of its value.
The SGD contagion: Sentiment overriding fundamentals
The Singaporean experience in 1997 is a landmark case of ŌĆ£pure contagion.ŌĆØ Unlike its neighbors, Singapore entered the crisis with exceptionally strong economic health.
The Asian crisis began in Thailand and demonstrated how ŌĆ£structural rotŌĆØ in one nation can trigger a ŌĆ£confidence shockŌĆØ across neighbours, regardless of their individual fundamentals.
- Robust buffers: Singapore held high levels of foreign reserves and consistently recorded fiscal surpluses.
- Constitutional restraint: The Singapore Constitution mandated a balanced budget over each term of government, preventing the fiscal overreach seen elsewhere.
- Banking health: SingaporeŌĆÖs financial sector was well-regulated, with minimal doubtful loans or unhedged short-term foreign debt.
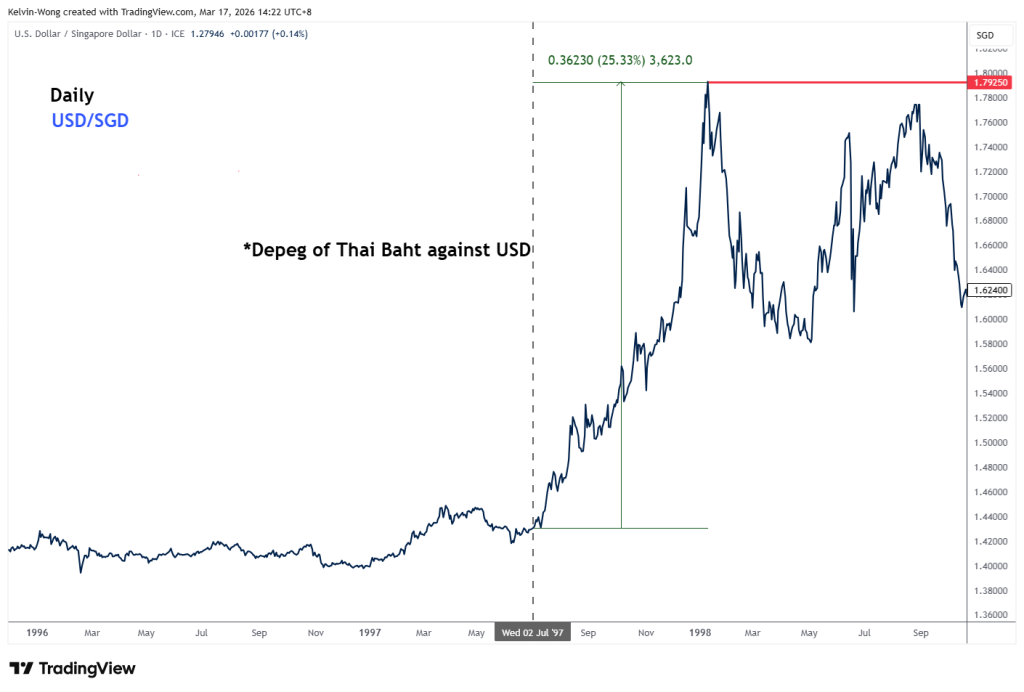
Despite these ŌĆ£best-in-classŌĆØ fundamentals, the Singapore dollar (SGD) was caught in the regional vortex. Between mid-1997 and early 1998, the against the USD (see Fig. 2).
Strategic response: The Monetary Authority of Singapore (MAS) utilized its ŌĆ£managed floatŌĆØ framework. Rather than depleting reserves to defend an arbitrary level, MAS allowed the SGD to ease in line with regional sentiment to facilitate economic recovery. This ŌĆ£acceptanceŌĆØ of market-driven depreciation deterred speculators and prevented the need for the economy-crushing interest rate hikes seen in Hong Kong. While slowed to 1.5% in 1998, its sound architecture allowed for a rapid ŌĆ£V-shapedŌĆØ recovery, with growth rebounding to 7.2% by 1999.
3. The 1998 Russian collapse: The GKO pyramid and the black swan of liquidity
The Russian crisis represents a lethal intersection of a first-generation fiscal deficit and a third-generation liquidity squeeze.
- The GKO pyramid: To finance persistent budget deficits, the Russian government issued ŌĆ£GKOsŌĆØ (short-term, Russian ruble-denominated treasury bills) at astronomical interest rates to attract foreign capital. By June 1998, monthly interest payments on government debt were 40% higher than total tax collections.
- The trigger: The 1997 Asian crisis caused a crash in global commodity prices. Russia, dependent on raw materials for 80% of its exports, saw its revenue evaporate.
- The default (Aug. 17, 1998): Russia devalued the ruble, defaulted on its domestic debt (GKOs), and declared a moratorium on foreign debt payments. The Ruble plummeted from 6.3 to 21 per USD in weeksŌĆöa 2/3 loss in value.
- The LTCM systemic blowup: The crisis triggered the near collapse of the U.S. hedge fund Long-Term Capital Management (LTCM). LTCM had used 30-times leverage to bet on ŌĆ£convergenceŌĆØ trades, if the yield spreads between Russian bonds and U.S. Treasuries would narrow. When Russia defaulted, a ŌĆ£flight to qualityŌĆØ caused these spreads to explode, resulting in a global liquidity crisis that required a $3.5 billion private rescue organized by the Federal Reserve.
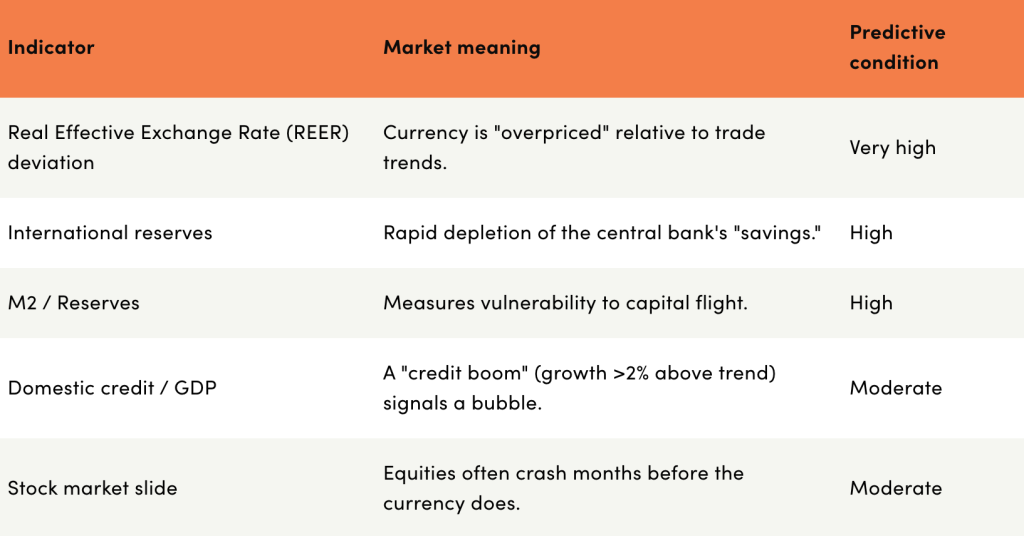
Early warning systems: Quantitative indicators for traders
Extensive empirical research () identifies specific ŌĆ£red flagsŌĆØ that behave unusually in the 24 months preceding a crisis.
Conclusion: Patterns repeat
For someone without a finance degree, the most important takeaway is that economic gravity always wins. Whether it is the U.K. in 1992, Thailand in 1997, or even more recent examples like (where the currency fell by over 50% after the country ran out of reserves to pay for fuel and medicine). The pattern is the same.
A crisis occurs when a governmentŌĆÖs promises (like a ŌĆ£fixedŌĆØ currency) no longer match their bank account or their actions. By watching for overvalued currencies, shrinking reserves, and excessive debt, you can see the ŌĆ£cracksŌĆØ in the system before the final collapse.
This article and its contents are intended for educational purposes only and should not be considered trading advice. Forex trading is high-risk. Losses may exceed deposits.
was produced by and reviewed and distributed by ▒¼┴ŽTV.


