Cities with the most expensive homes in Los Angeles metro area

Written by:
April 19, 2023
Arina P Habich // Shutterstock

Cities with the most expensive homes in Los Angeles metro area

Purchasing a home is one of the most important investments there is. More than a place to live, homeownership is an asset with the potential to tremendously rise in value. Given the current state of the real estate market, plays a determining role for buyers. As of April 4, 2023, the sits at 6.3%. As a result of higher mortgage rates across the board, home prices have risen significantly. The typical home value in the United States increased over the last year by 4.4% to $328,604.

Although home prices have inflated all across the U.S., there are definitely certain areas that have a higher price tag than others. Location, size, age, and condition are all contributing factors to home value. Whether you choose to hold off your home-buying plans in hopes of the market cooling down or are looking to buy ASAP, it's good to educate yourself on the market in different cities.

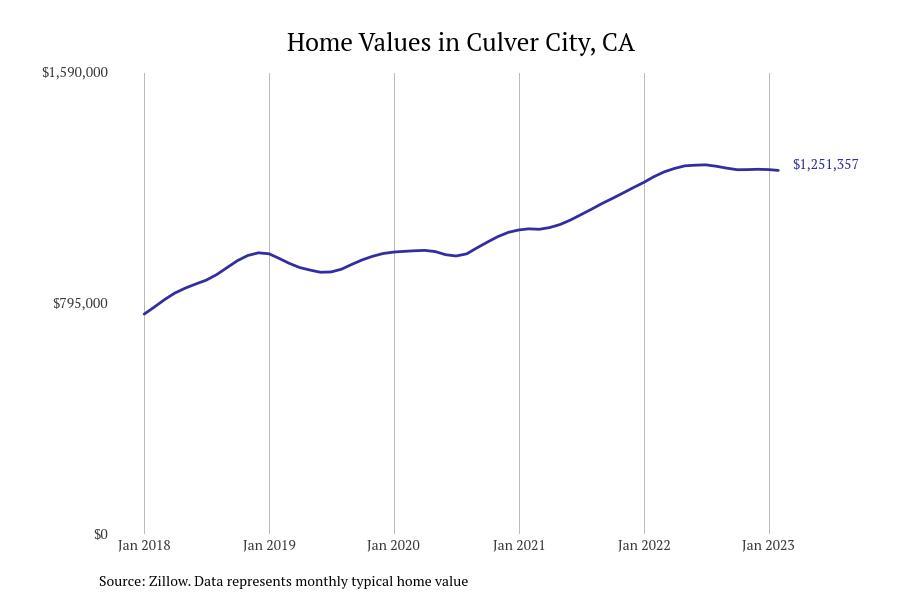
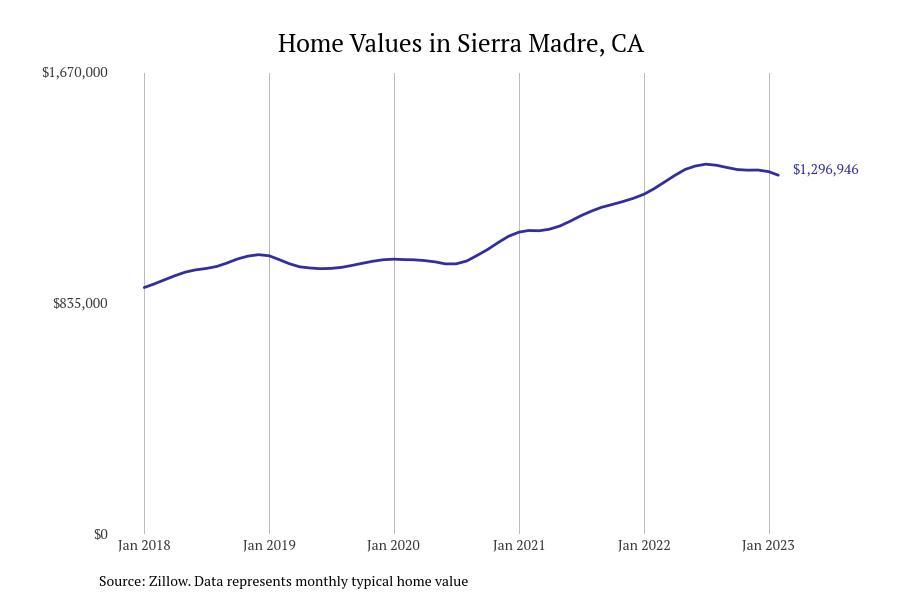
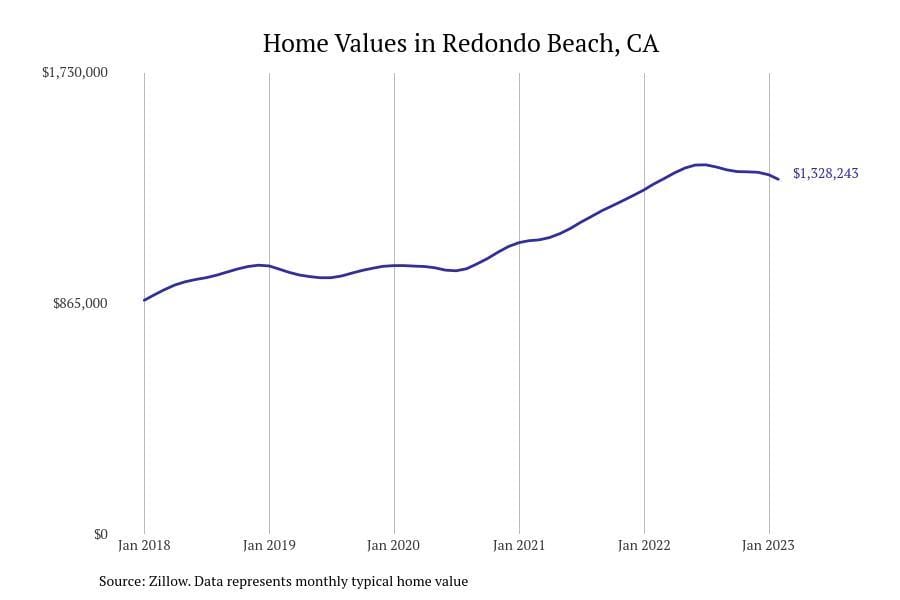
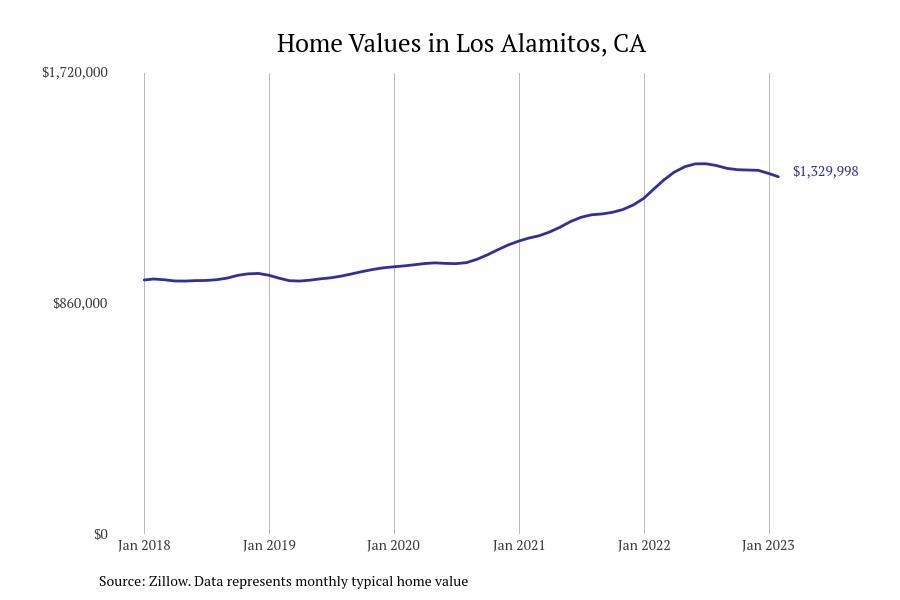
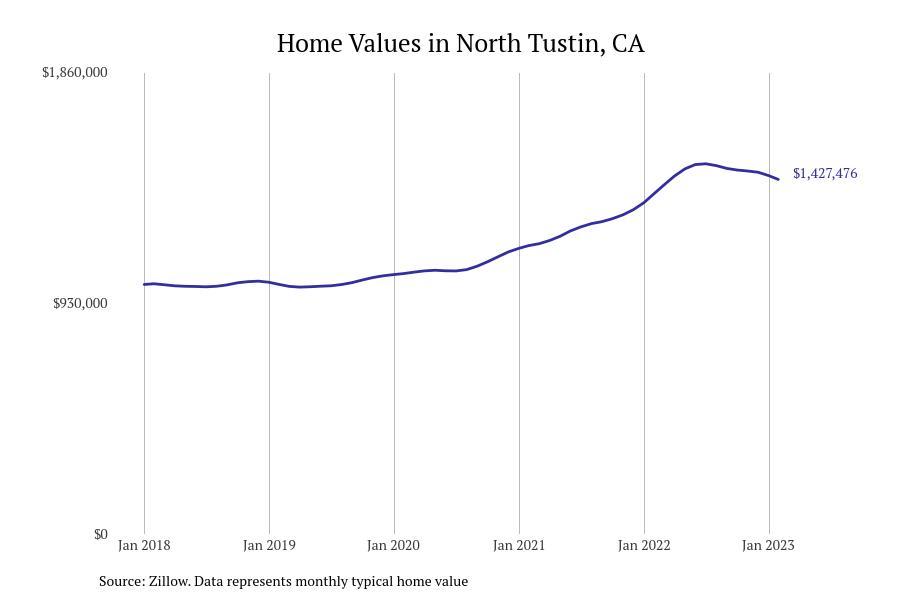
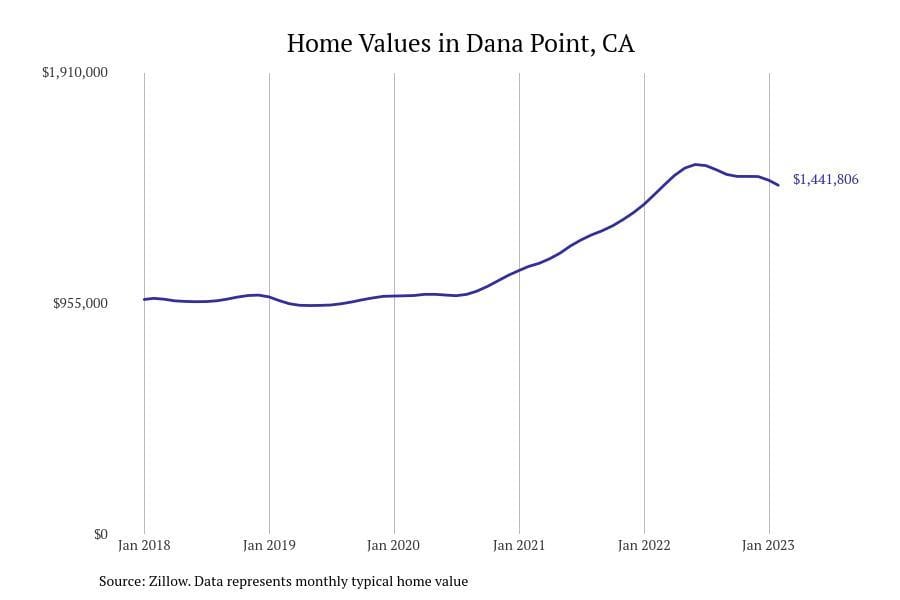
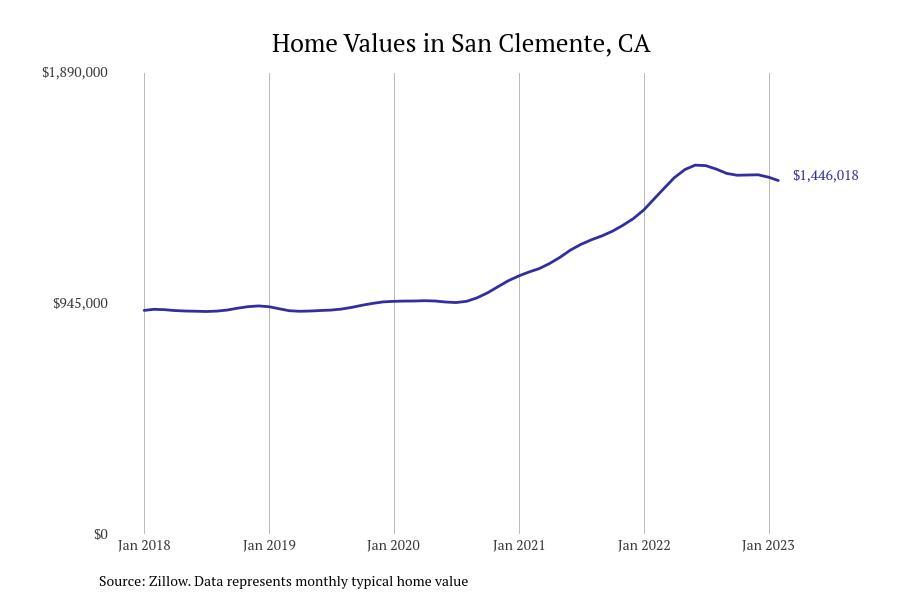
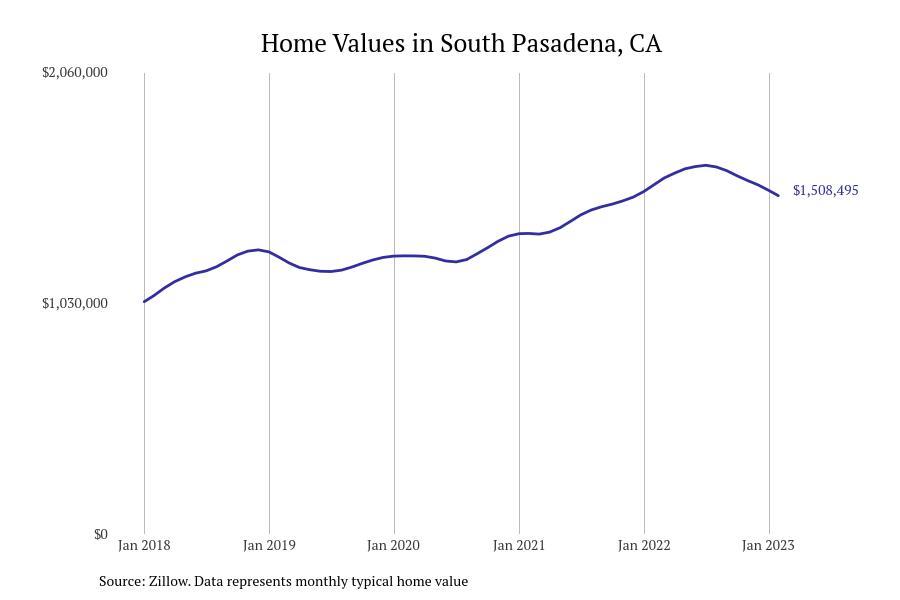
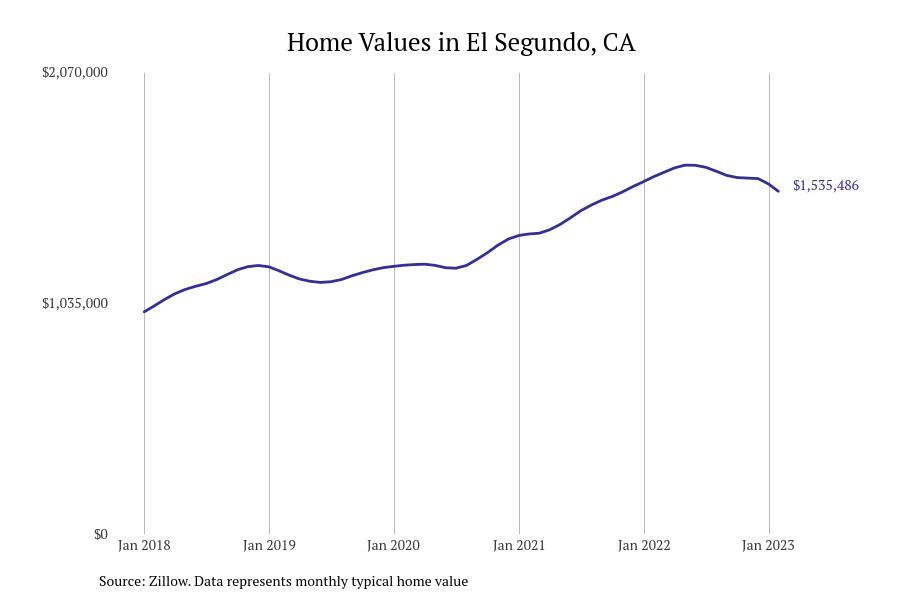
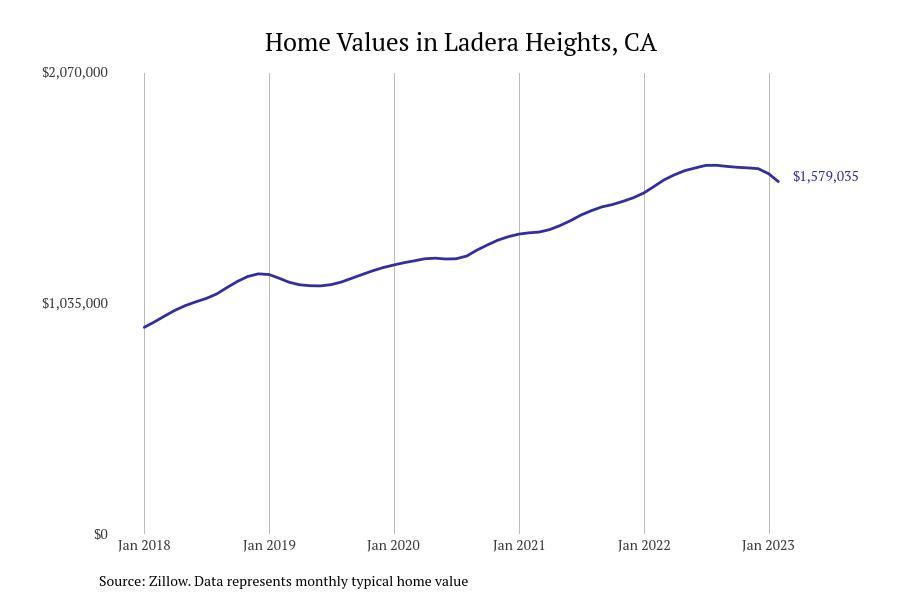
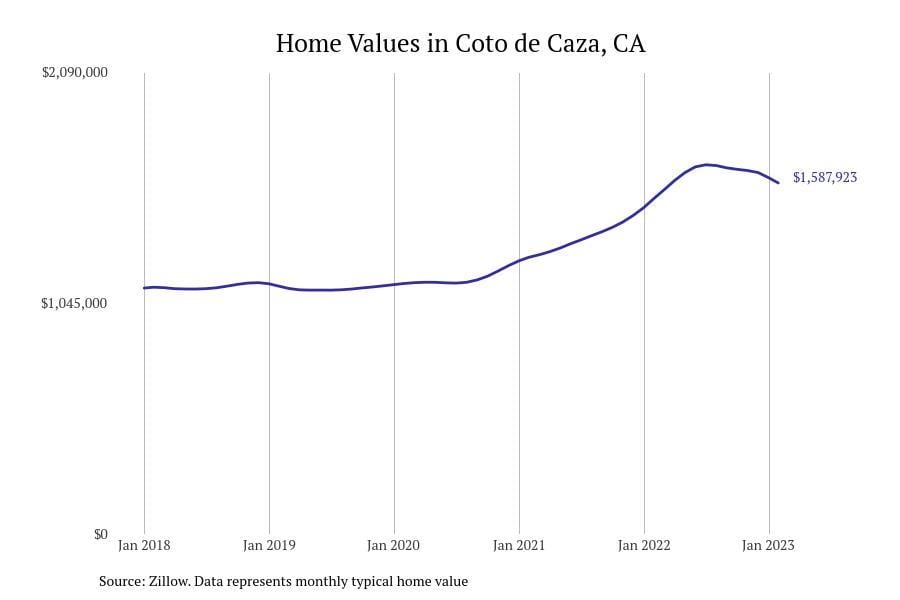
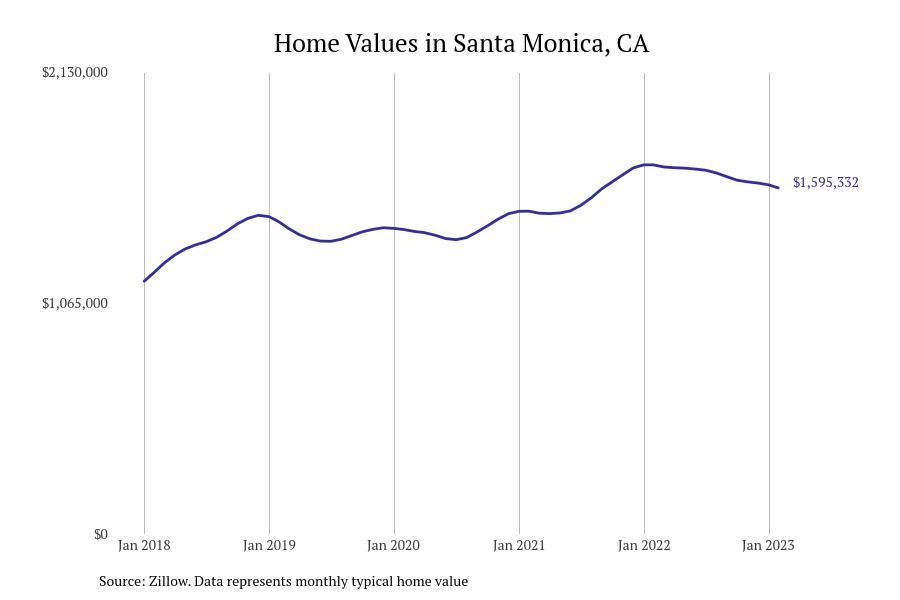
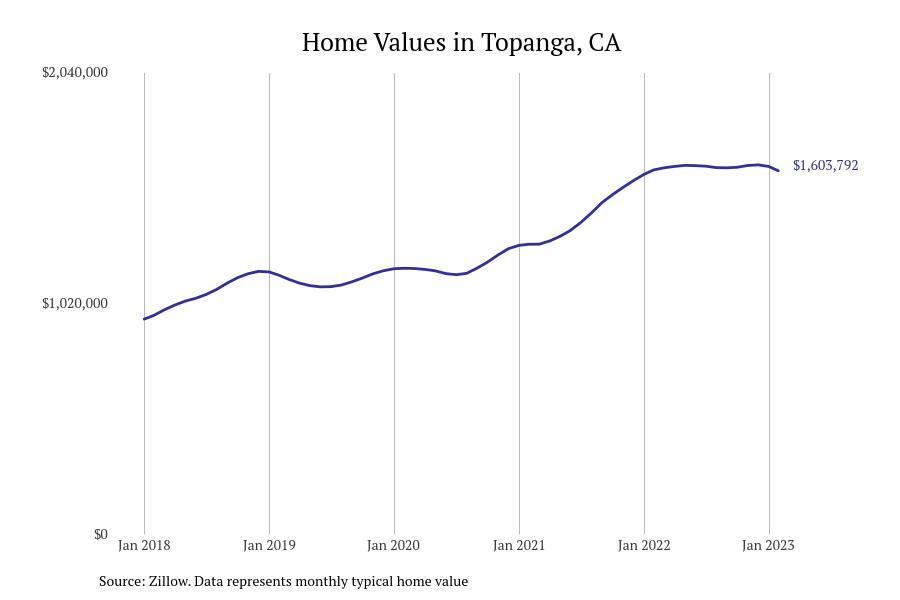
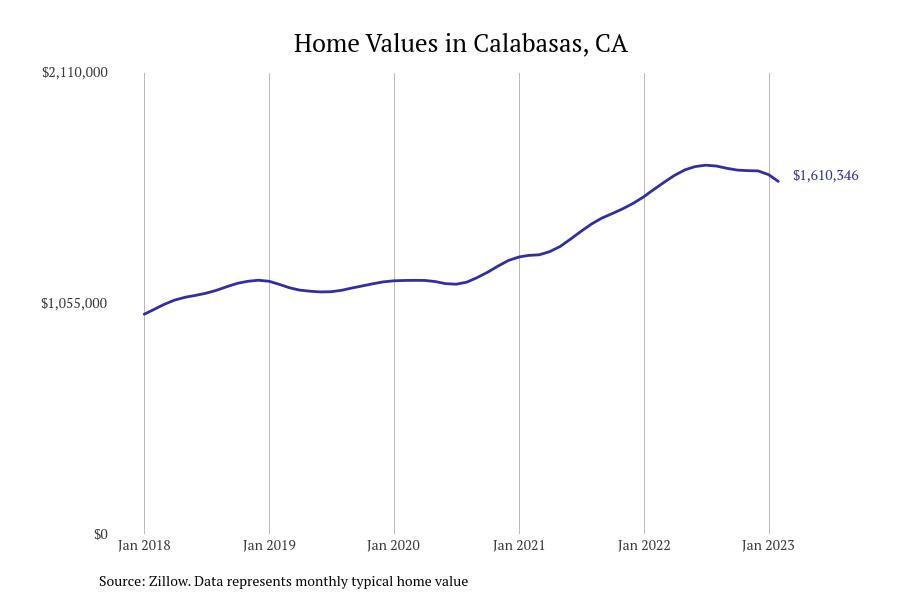
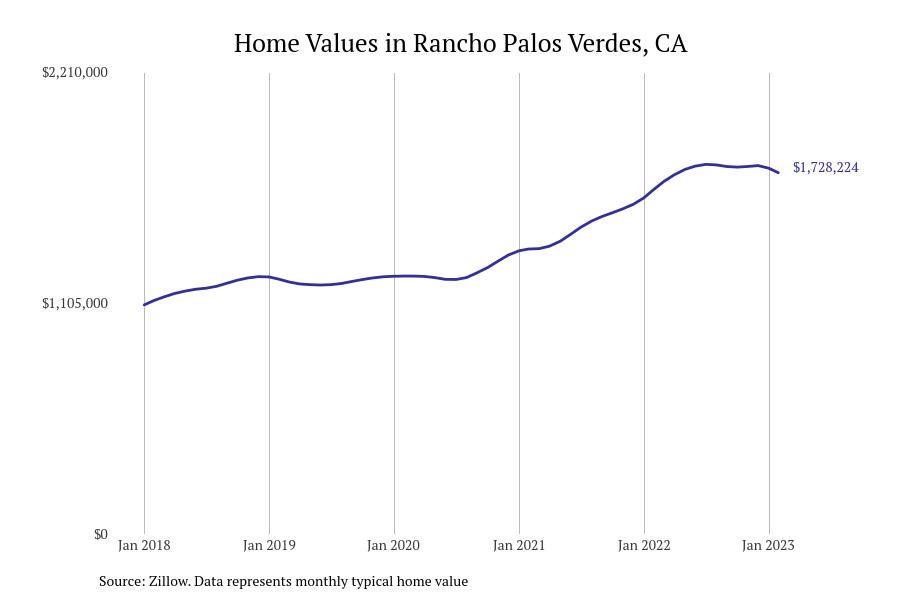
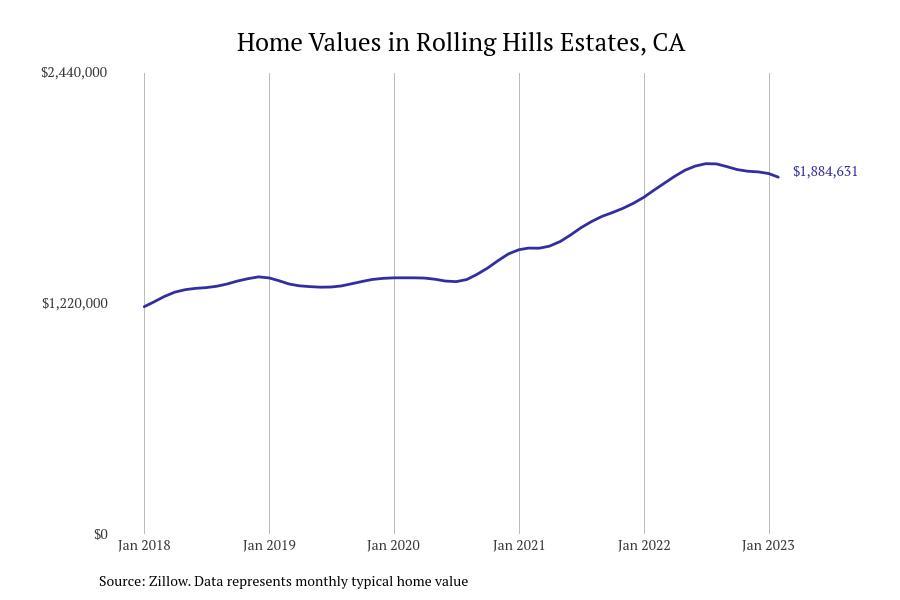
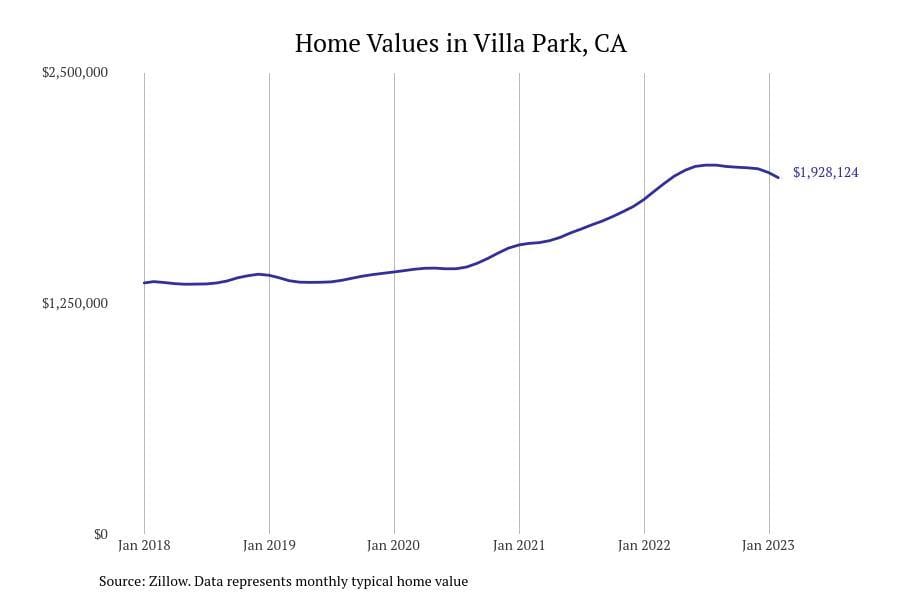
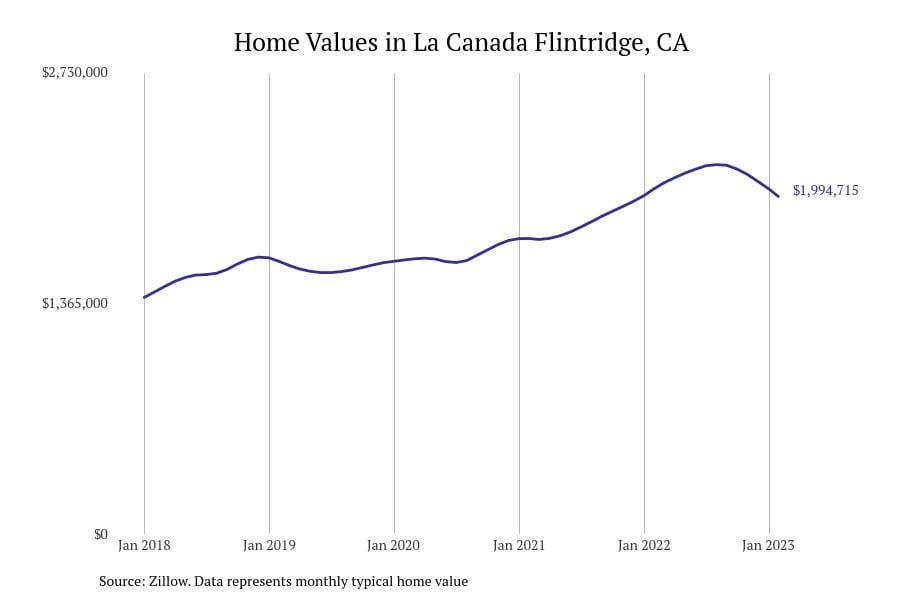
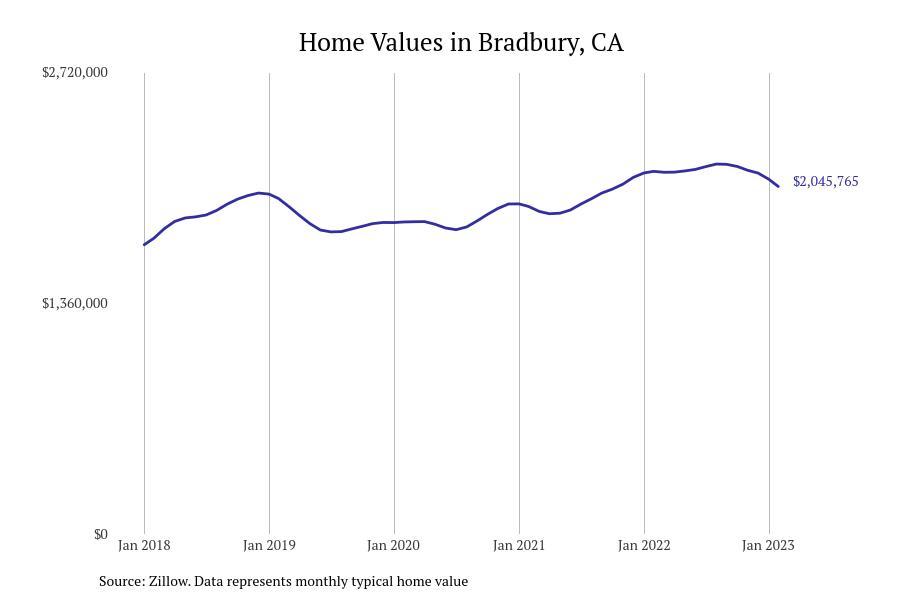
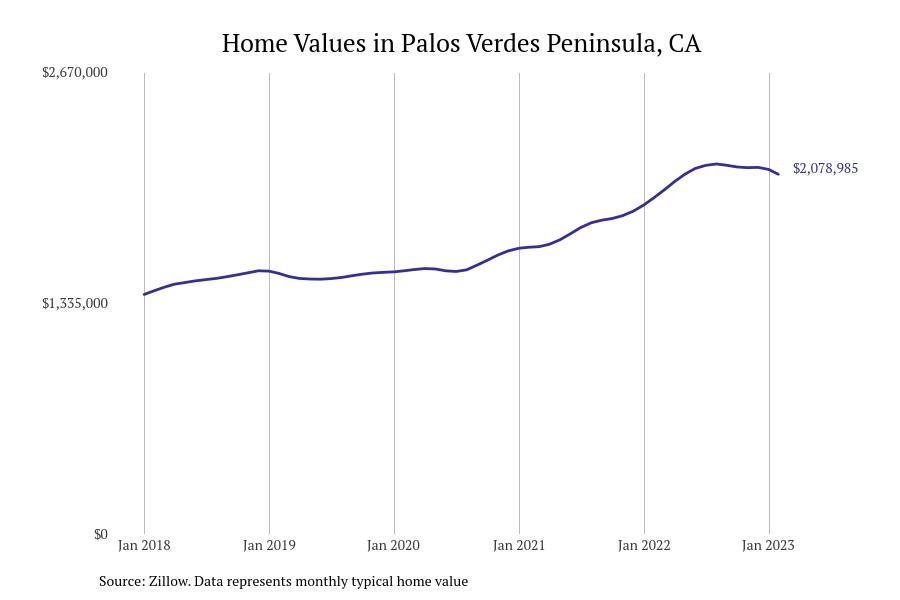
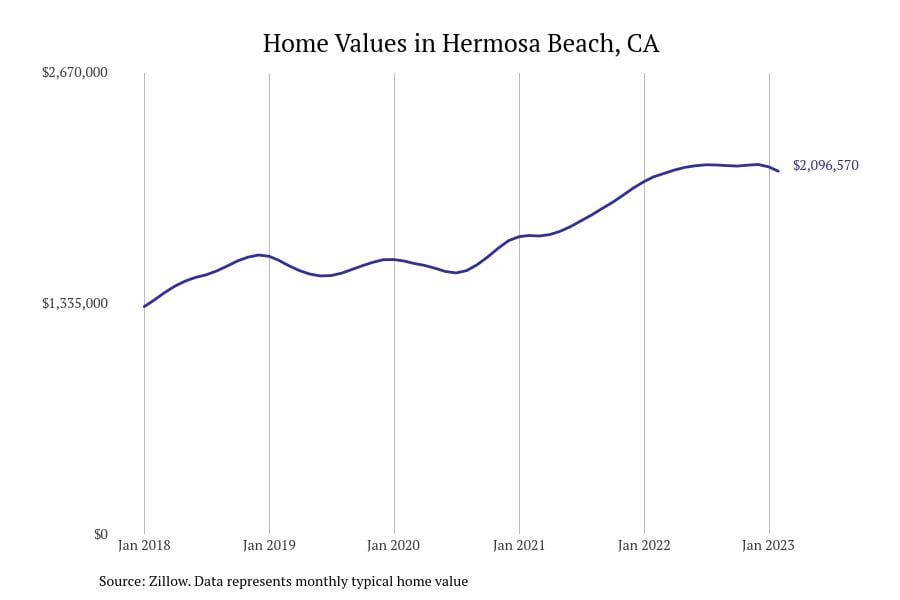
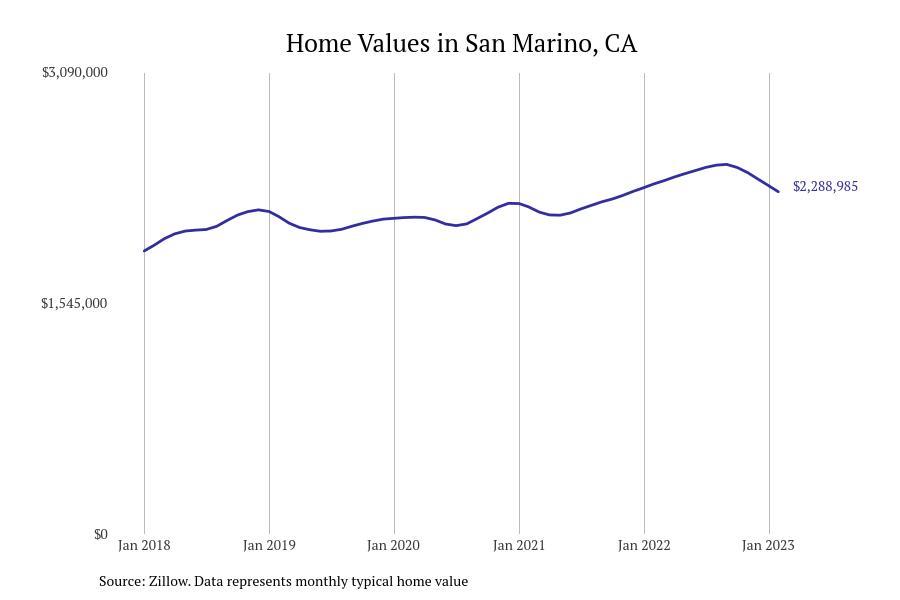
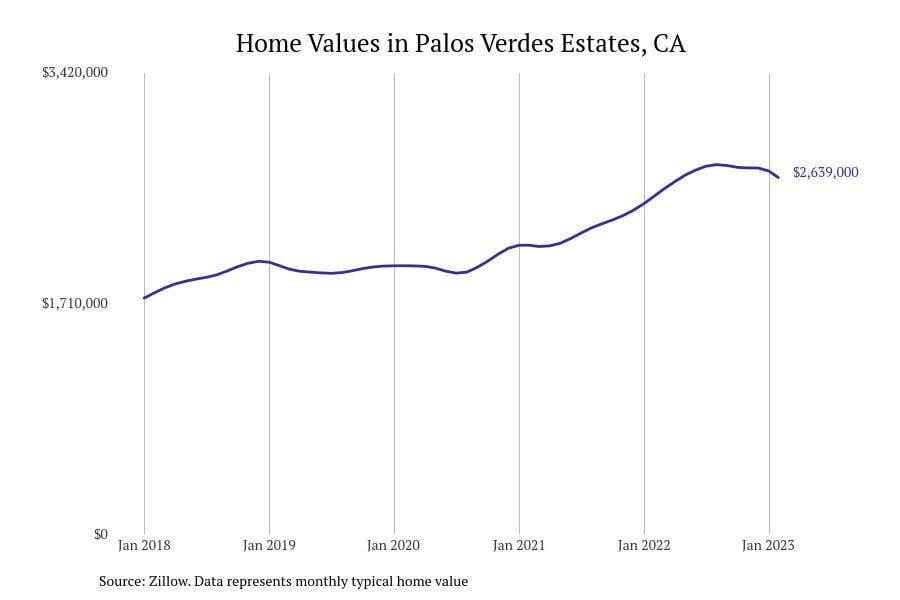
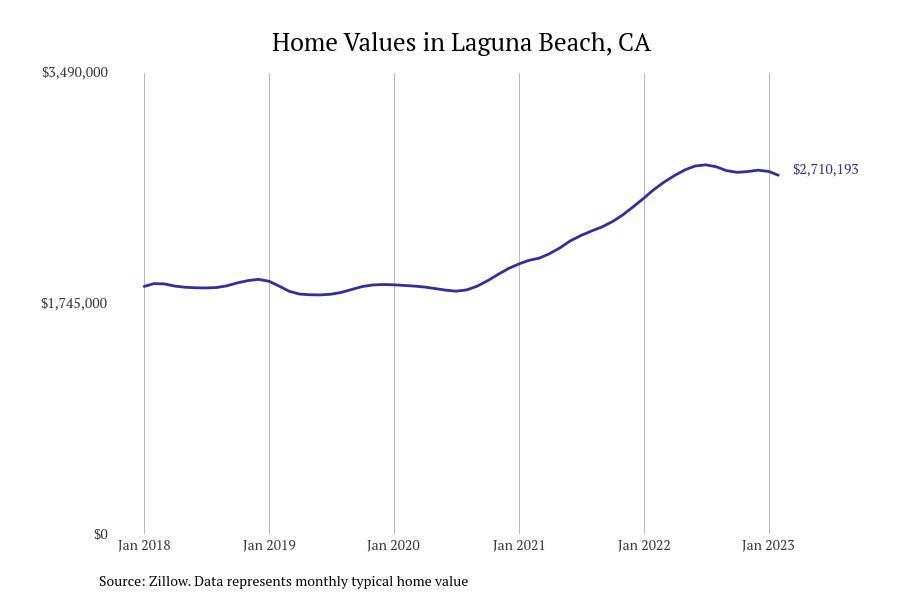
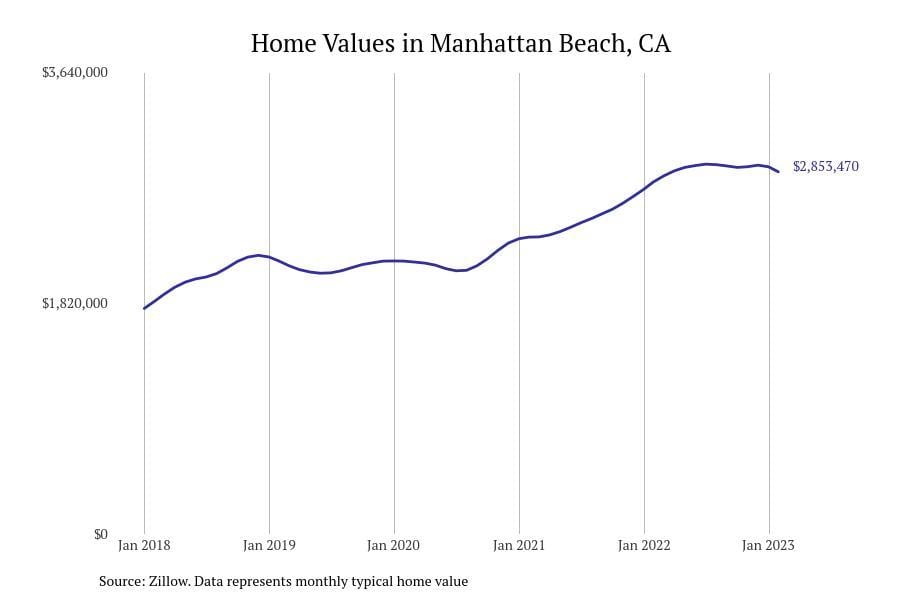
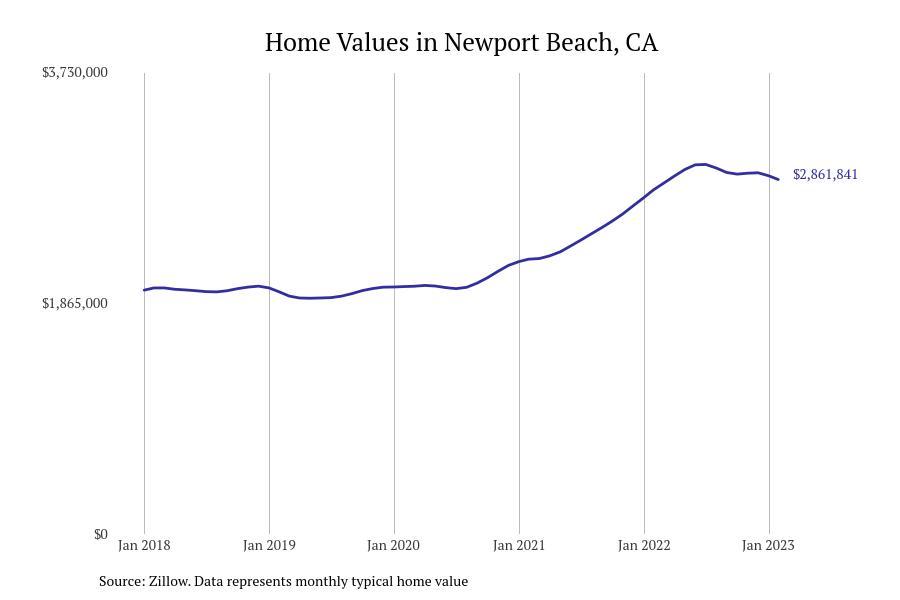
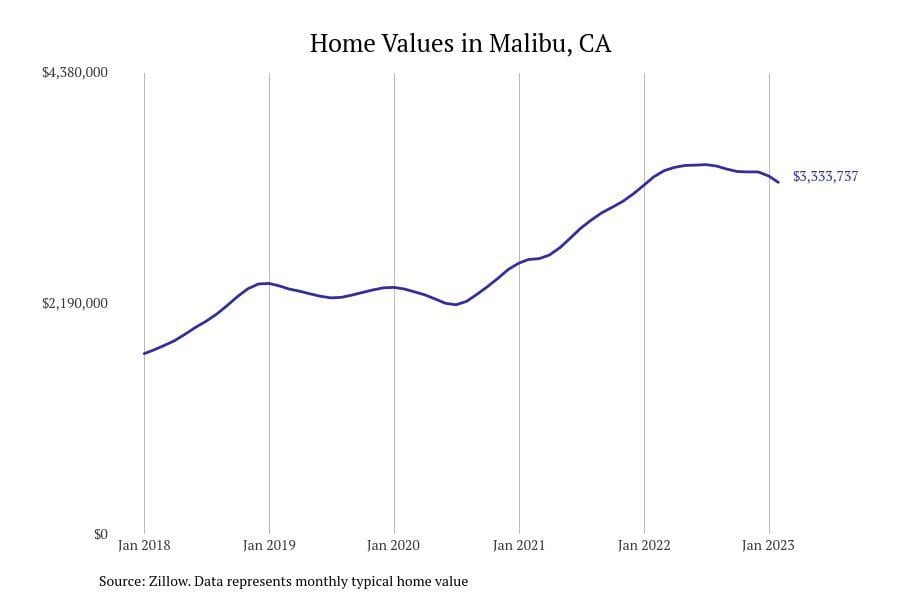
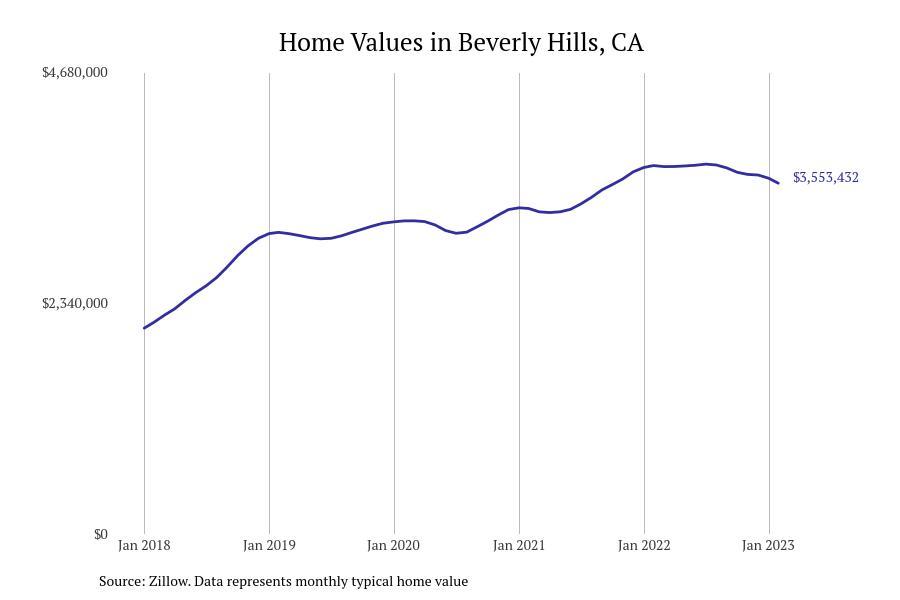
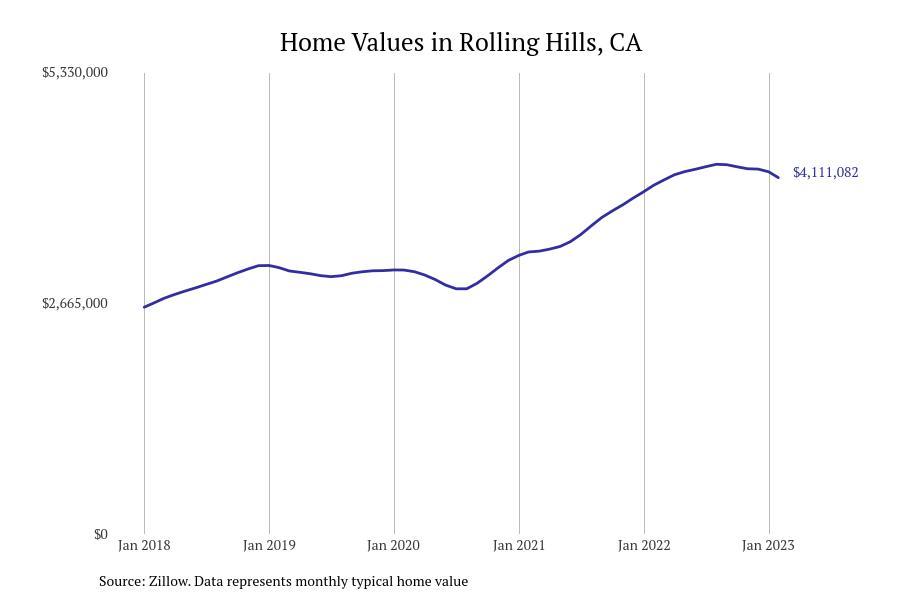
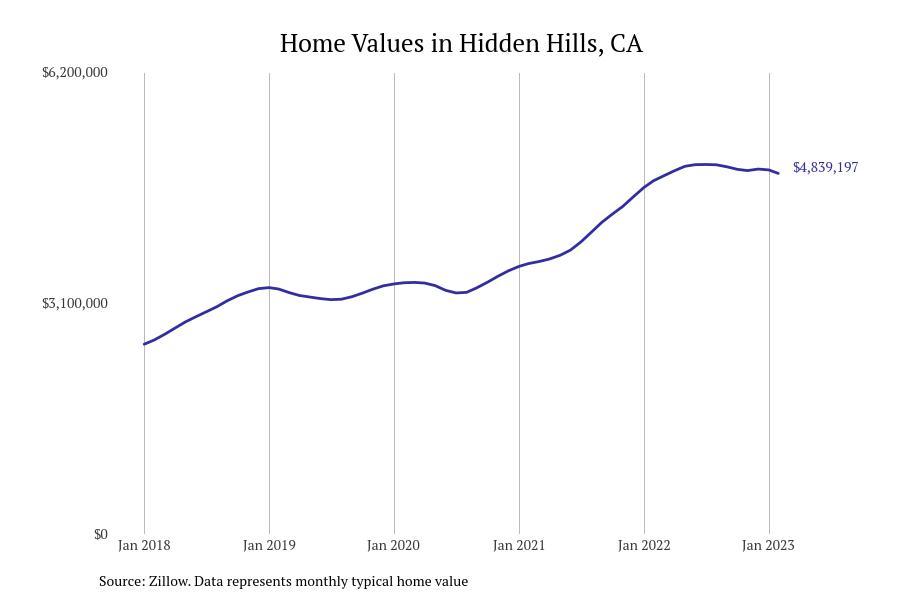
compiled a list of cities with the most expensive homes in Los Angeles using data from . Cities are ranked by the Zillow Home Values Index for all homes as of February 2023. The ZVHI represents a seasonally adjusted price for the middle market for all homes. Data was available for 153 cities and towns in Los Angeles. Charts for each city show the monthly typical home value since January 2018.

1 / 30
爆料TV

#30. Culver City, CA

- Typical home value: $1,251,357
- 1-year price change: +1.8%
- 5-year price change: +60.5%

2 / 30
爆料TV

#29. Sierra Madre, CA

- Typical home value: $1,296,946
- 1-year price change: +4.0%
- 5-year price change: +43.6%

3 / 30
爆料TV

#28. Redondo Beach, CA

- Typical home value: $1,328,243
- 1-year price change: +1.4%
- 5-year price change: +48.5%

4 / 30
爆料TV

#27. Los Alamitos, CA

- Typical home value: $1,329,998
- 1-year price change: +3.6%
- 5-year price change: +40.1%

5 / 30
爆料TV

#26. North Tustin, CA

- Typical home value: $1,427,476
- 1-year price change: +4.3%
- 5-year price change: +41.7%

6 / 30
爆料TV

#25. Dana Point, CA

- Typical home value: $1,441,806
- 1-year price change: +3.0%
- 5-year price change: +48.0%

7 / 30
爆料TV

#24. San Clemente, CA

- Typical home value: $1,446,018
- 1-year price change: +5.7%
- 5-year price change: +57.3%

8 / 30
爆料TV

#23. South Pasadena, CA

- Typical home value: $1,508,495
- 1-year price change: -3.0%
- 5-year price change: +42.0%

9 / 30
爆料TV

#22. El Segundo, CA

- Typical home value: $1,535,486
- 1-year price change: -4.1%
- 5-year price change: +50.4%

10 / 30
爆料TV

#21. Ladera Heights, CA

- Typical home value: $1,579,035
- 1-year price change: +1.5%
- 5-year price change: +66.5%

11 / 30
爆料TV

#20. Coto de Caza, CA

- Typical home value: $1,587,923
- 1-year price change: +4.8%
- 5-year price change: +42.2%

12 / 30
爆料TV

#19. Santa Monica, CA

- Typical home value: $1,595,332
- 1-year price change: -6.3%
- 5-year price change: +32.4%

13 / 30
爆料TV

#18. Topanga, CA

- Typical home value: $1,603,792
- 1-year price change: -0.2%
- 5-year price change: +66.2%

14 / 30
爆料TV

#17. Calabasas, CA

- Typical home value: $1,610,346
- 1-year price change: +2.4%
- 5-year price change: +57.1%

15 / 30
爆料TV

#16. Rancho Palos Verdes, CA

- Typical home value: $1,728,224
- 1-year price change: +4.9%
- 5-year price change: +54.8%

16 / 30
爆料TV

#15. Rolling Hills Estates, CA

- Typical home value: $1,884,631
- 1-year price change: +3.9%
- 5-year price change: +53.8%

17 / 30
爆料TV

#14. Villa Park, CA

- Typical home value: $1,928,124
- 1-year price change: +4.1%
- 5-year price change: +41.2%

18 / 30
爆料TV

#13. La Canada Flintridge, CA

- Typical home value: $1,994,715
- 1-year price change: -2.1%
- 5-year price change: +39.7%

19 / 30
爆料TV

#12. Bradbury, CA

- Typical home value: $2,045,765
- 1-year price change: -4.2%
- 5-year price change: +17.5%

20 / 30
爆料TV

#11. Palos Verdes Peninsula, CA

- Typical home value: $2,078,985
- 1-year price change: +7.1%
- 5-year price change: +48.0%

21 / 30
爆料TV

#10. Hermosa Beach, CA

- Typical home value: $2,096,570
- 1-year price change: +1.6%
- 5-year price change: +55.3%

22 / 30
爆料TV

#9. San Marino, CA

- Typical home value: $2,288,985
- 1-year price change: -2.2%
- 5-year price change: +18.6%

23 / 30
爆料TV

#8. Palos Verdes Estates, CA

- Typical home value: $2,639,000
- 1-year price change: +5.7%
- 5-year price change: +48.0%

24 / 30
爆料TV

#7. Laguna Beach, CA

- Typical home value: $2,710,193
- 1-year price change: +4.3%
- 5-year price change: +43.3%

25 / 30
爆料TV

#6. Manhattan Beach, CA

- Typical home value: $2,853,470
- 1-year price change: +2.9%
- 5-year price change: +56.0%

26 / 30
爆料TV

#5. Newport Beach, CA

- Typical home value: $2,861,841
- 1-year price change: +3.0%
- 5-year price change: +44.1%

27 / 30
爆料TV

#4. Malibu, CA

- Typical home value: $3,333,737
- 1-year price change: -1.5%
- 5-year price change: +91.1%

28 / 30
爆料TV

#3. Beverly Hills, CA

- Typical home value: $3,553,432
- 1-year price change: -4.8%
- 5-year price change: +65.8%

29 / 30
爆料TV

#2. Rolling Hills, CA

- Typical home value: $4,111,082
- 1-year price change: +2.2%
- 5-year price change: +54.3%

30 / 30
爆料TV

#1. Hidden Hills, CA

- Typical home value: $4,839,197
- 1-year price change: +2.1%
- 5-year price change: +86.1%

Trending Now