爆料TV

Where people in Denver are moving to most

路爆料TV

Canva
Canva
compiled a list of where people in Denver-Aurora-Lakewood, CO Metro Area are moving to the most using data from the . Metros are ranked by the estimated number of people who moved to the metro from Denver between 2015 and 2019. Ties were broken by gross migration.

You may also like: Coat drives near Denver

1 / 50

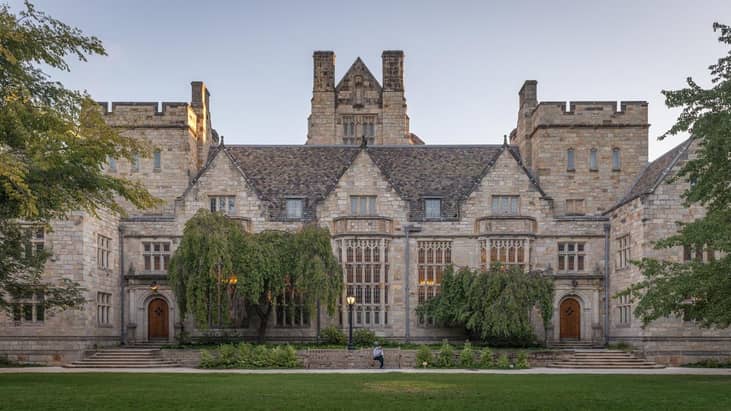
#50. Santa Maria-Santa Barbara, CA Metro Area

- Migration to Santa Maria in 2015-2019: 448
- Migration from Santa Maria to Denver: 310 (#16 most common destination from Santa Maria)
- Net migration: 138 to Santa Maria
2 / 50

#49. Detroit-Warren-Dearborn, MI Metro Area

- Migration to Detroit in 2015-2019: 470
- Migration from Detroit to Denver: 532 (#37 most common destination from Detroit)
- Net migration: 62 to Denver
3 / 50

#48. Riverside-San Bernardino-Ontario, CA Metro Area

- Migration to Riverside in 2015-2019: 484
- Migration from Riverside to Denver: 1,418 (#14 most common destination from Riverside)
- Net migration: 934 to Denver
4 / 50

#47. Lincoln, NE Metro Area

- Migration to Lincoln in 2015-2019: 488
- Migration from Lincoln to Denver: 512 (#3 most common destination from Lincoln)
- Net migration: 24 to Denver
5 / 50

#46. Cheyenne, WY Metro Area

- Migration to Cheyenne in 2015-2019: 492
- Migration from Cheyenne to Denver: 319 (#2 most common destination from Cheyenne)
- Net migration: 173 to Cheyenne

You may also like: The highest-value homes in Denver

6 / 50

#45. Little Rock-North Little Rock-Conway, AR Metro Area

- Migration to Little Rock in 2015-2019: 500
- Migration from Little Rock to Denver: 310 (#16 most common destination from Little Rock)
- Net migration: 190 to Little Rock
7 / 50

#44. Nashville-Davidson--Murfreesboro--Franklin, TN Metro Area

- Migration to Nashville in 2015-2019: 505
- Migration from Nashville to Denver: 496 (#25 most common destination from Nashville)
- Net migration: 9 to Nashville
8 / 50

#43. Columbus, OH Metro Area

- Migration to Columbus in 2015-2019: 510
- Migration from Columbus to Denver: 458 (#28 most common destination from Columbus)
- Net migration: 52 to Columbus
9 / 50

#42. Provo-Orem, UT Metro Area

- Migration to Provo in 2015-2019: 516
- Migration from Provo to Denver: 294 (#17 most common destination from Provo)
- Net migration: 222 to Provo
11 / 50

#40. Wichita, KS Metro Area

- Migration to Wichita in 2015-2019: 565
- Migration from Wichita to Denver: 367 (#13 most common destination from Wichita)
- Net migration: 198 to Wichita
12 / 50

#39. Palm Bay-Melbourne-Titusville, FL Metro Area

- Migration to Palm Bay in 2015-2019: 575
- Migration from Palm Bay to Denver: 162 (#26 most common destination from Palm Bay)
- Net migration: 413 to Palm Bay
13 / 50

#38. St. Louis, MO-IL Metro Area

- Migration to St. Louis in 2015-2019: 579
- Migration from St. Louis to Denver: 1,178 (#12 most common destination from St. Louis)
- Net migration: 599 to Denver
14 / 50

#37. Charlotte-Concord-Gastonia, NC-SC Metro Area

- Migration to Charlotte in 2015-2019: 622
- Migration from Charlotte to Denver: 716 (#26 most common destination from Charlotte)
- Net migration: 94 to Denver
15 / 50

#36. Salt Lake City, UT Metro Area

- Migration to Salt Lake City in 2015-2019: 628
- Migration from Salt Lake City to Denver: 651 (#14 most common destination from Salt Lake City)
- Net migration: 23 to Denver

You may also like: Highest-rated delis in Denver by diners

16 / 50

#35. Omaha-Council Bluffs, NE-IA Metro Area

- Migration to Omaha in 2015-2019: 631
- Migration from Omaha to Denver: 880 (#4 most common destination from Omaha)
- Net migration: 249 to Denver
17 / 50

#34. San Jose-Sunnyvale-Santa Clara, CA Metro Area

- Migration to San Jose in 2015-2019: 639
- Migration from San Jose to Denver: 541 (#33 most common destination from San Jose)
- Net migration: 98 to San Jose
18 / 50

#33. Orlando-Kissimmee-Sanford, FL Metro Area

- Migration to Orlando in 2015-2019: 666
- Migration from Orlando to Denver: 1,058 (#22 most common destination from Orlando)
- Net migration: 392 to Denver
19 / 50

#32. Atlanta-Sandy Springs-Alpharetta, GA Metro Area

- Migration to Atlanta in 2015-2019: 696
- Migration from Atlanta to Denver: 1,624 (#28 most common destination from Atlanta)
- Net migration: 928 to Denver
20 / 50

#31. Boise City, ID Metro Area

- Migration to Boise City in 2015-2019: 714
- Migration from Boise City to Denver: 166 (#28 most common destination from Boise City)
- Net migration: 548 to Boise City

You may also like: Best private K-12 schools in the Denver metro area

21 / 50

#30. Boston-Cambridge-Newton, MA-NH Metro Area

- Migration to Boston in 2015-2019: 748
- Migration from Boston to Denver: 1,637 (#18 most common destination from Boston)
- Net migration: 889 to Denver
22 / 50

#29. Portland-Vancouver-Hillsboro, OR-WA Metro Area

- Migration to Portland in 2015-2019: 752
- Migration from Portland to Denver: 1,316 (#13 most common destination from Portland)
- Net migration: 564 to Denver
23 / 50

#28. Oklahoma City, OK Metro Area

- Migration to Oklahoma City in 2015-2019: 762
- Migration from Oklahoma City to Denver: 602 (#8 most common destination from Oklahoma City)
- Net migration: 160 to Oklahoma City
24 / 50

#27. Miami-Fort Lauderdale-Pompano Beach, FL Metro Area

- Migration to Miami in 2015-2019: 763
- Migration from Miami to Denver: 1,329 (#26 most common destination from Miami)
- Net migration: 566 to Denver
25 / 50

#26. Philadelphia-Camden-Wilmington, PA-NJ-DE-MD Metro Area

- Migration to Philadelphia in 2015-2019: 811
- Migration from Philadelphia to Denver: 1,679 (#26 most common destination from Philadelphia)
- Net migration: 868 to Denver

You may also like: Are home prices going down in Denver in 2026?

26 / 50

#25. Des Moines-West Des Moines, IA Metro Area

- Migration to Des Moines in 2015-2019: 891
- Migration from Des Moines to Denver: 328 (#14 most common destination from Des Moines)
- Net migration: 563 to Des Moines
27 / 50

#24. Albuquerque, NM Metro Area

- Migration to Albuquerque in 2015-2019: 990
- Migration from Albuquerque to Denver: 1,005 (#4 most common destination from Albuquerque)
- Net migration: 15 to Denver
28 / 50

#23. San Antonio-New Braunfels, TX Metro Area

- Migration to San Antonio in 2015-2019: 1,038
- Migration from San Antonio to Denver: 546 (#31 most common destination from San Antonio)
- Net migration: 492 to San Antonio
29 / 50

#22. Minneapolis-St. Paul-Bloomington, MN-WI Metro Area

- Migration to Minneapolis in 2015-2019: 1,089
- Migration from Minneapolis to Denver: 2,189 (#7 most common destination from Minneapolis)
- Net migration: 1,100 to Denver
30 / 50

#21. Kansas City, MO-KS Metro Area

- Migration to Kansas City in 2015-2019: 1,173
- Migration from Kansas City to Denver: 1,455 (#8 most common destination from Kansas City)
- Net migration: 282 to Denver

You may also like: Michelin-starred restaurants in Denver

31 / 50

#20. Tampa-St. Petersburg-Clearwater, FL Metro Area

- Migration to Tampa in 2015-2019: 1,179
- Migration from Tampa to Denver: 1,287 (#15 most common destination from Tampa)
- Net migration: 108 to Denver
32 / 50

#19. Austin-Round Rock-Georgetown, TX Metro Area

- Migration to Austin in 2015-2019: 1,225
- Migration from Austin to Denver: 1,428 (#10 most common destination from Austin)
- Net migration: 203 to Denver
33 / 50

#18. San Diego-Chula Vista-Carlsbad, CA Metro Area

- Migration to San Diego in 2015-2019: 1,255
- Migration from San Diego to Denver: 1,796 (#15 most common destination from San Diego)
- Net migration: 541 to Denver
34 / 50

#17. San Francisco-Oakland-Berkeley, CA Metro Area

- Migration to San Francisco in 2015-2019: 1,272
- Migration from San Francisco to Denver: 2,531 (#20 most common destination from San Francisco)
- Net migration: 1,259 to Denver
35 / 50

#16. Tucson, AZ Metro Area

- Migration to Tucson in 2015-2019: 1,305
- Migration from Tucson to Denver: 534 (#13 most common destination from Tucson)
- Net migration: 771 to Tucson

You may also like: Best colleges in Denver

36 / 50

#15. New York-Newark-Jersey City, NY-NJ-PA Metro Area

- Migration to New York in 2015-2019: 1,345
- Migration from New York to Denver: 3,786 (#31 most common destination from New York)
- Net migration: 2,441 to Denver
37 / 50

#14. Grand Junction, CO Metro Area

- Migration to Grand Junction in 2015-2019: 1,520
- Migration from Grand Junction to Denver: 1,171 (#1 most common destination from Grand Junction)
- Net migration: 349 to Grand Junction
38 / 50

#13. Pueblo, CO Metro Area

- Migration to Pueblo in 2015-2019: 1,562
- Migration from Pueblo to Denver: 1,090 (#2 most common destination from Pueblo)
- Net migration: 472 to Pueblo
39 / 50

#12. Chicago-Naperville-Elgin, IL-IN-WI Metro Area

- Migration to Chicago in 2015-2019: 1,852
- Migration from Chicago to Denver: 4,555 (#12 most common destination from Chicago)
- Net migration: 2,703 to Denver
40 / 50

#11. Washington-Arlington-Alexandria, DC-VA-MD-WV Metro Area

- Migration to Washington in 2015-2019: 1,870
- Migration from Washington to Denver: 3,826 (#13 most common destination from Washington)
- Net migration: 1,956 to Denver

You may also like: How much does it cost to buy a house in Denver in 2026?

41 / 50

#10. Las Vegas-Henderson-Paradise, NV Metro Area

- Migration to Las Vegas in 2015-2019: 2,081
- Migration from Las Vegas to Denver: 1,414 (#9 most common destination from Las Vegas)
- Net migration: 667 to Las Vegas
42 / 50

#9. Dallas-Fort Worth-Arlington, TX Metro Area

- Migration to Dallas in 2015-2019: 2,485
- Migration from Dallas to Denver: 3,204 (#12 most common destination from Dallas)
- Net migration: 719 to Denver
43 / 50

#8. Houston-The Woodlands-Sugar Land, TX Metro Area

- Migration to Houston in 2015-2019: 2,644
- Migration from Houston to Denver: 3,201 (#6 most common destination from Houston)
- Net migration: 557 to Denver
44 / 50

#7. Los Angeles-Long Beach-Anaheim, CA Metro Area

- Migration to Los Angeles in 2015-2019: 2,875
- Migration from Los Angeles to Denver: 4,347 (#18 most common destination from Los Angeles)
- Net migration: 1,472 to Denver
45 / 50

#6. Seattle-Tacoma-Bellevue, WA Metro Area

- Migration to Seattle in 2015-2019: 3,280
- Migration from Seattle to Denver: 1,438 (#24 most common destination from Seattle)
- Net migration: 1,842 to Seattle

You may also like: Best high schools in the Denver metro area

46 / 50

#5. Phoenix-Mesa-Chandler, AZ Metro Area

- Migration to Phoenix in 2015-2019: 4,052
- Migration from Phoenix to Denver: 2,890 (#10 most common destination from Phoenix)
- Net migration: 1,162 to Phoenix
47 / 50

#4. Greeley, CO Metro Area

- Migration to Greeley in 2015-2019: 7,538
- Migration from Greeley to Denver: 3,619 (#2 most common destination from Greeley)
- Net migration: 3,919 to Greeley
48 / 50

#3. Fort Collins, CO Metro Area

- Migration to Fort Collins in 2015-2019: 7,872
- Migration from Fort Collins to Denver: 4,338 (#2 most common destination from Fort Collins)
- Net migration: 3,534 to Fort Collins
49 / 50

#2. Boulder, CO Metro Area

- Migration to Boulder in 2015-2019: 10,661
- Migration from Boulder to Denver: 11,312 (#1 most common destination from Boulder)
- Net migration: 651 to Denver
50 / 50

#1. Colorado Springs, CO Metro Area

- Migration to Colorado Springs in 2015-2019: 12,361
- Migration from Colorado Springs to Denver: 6,798 (#1 most common destination from Colorado Springs)
- Net migration: 5,563 to Colorado Springs

You may also like: Movies and TV shows casting in Denver