The rise of road rage: Where drivers lose their cool the most
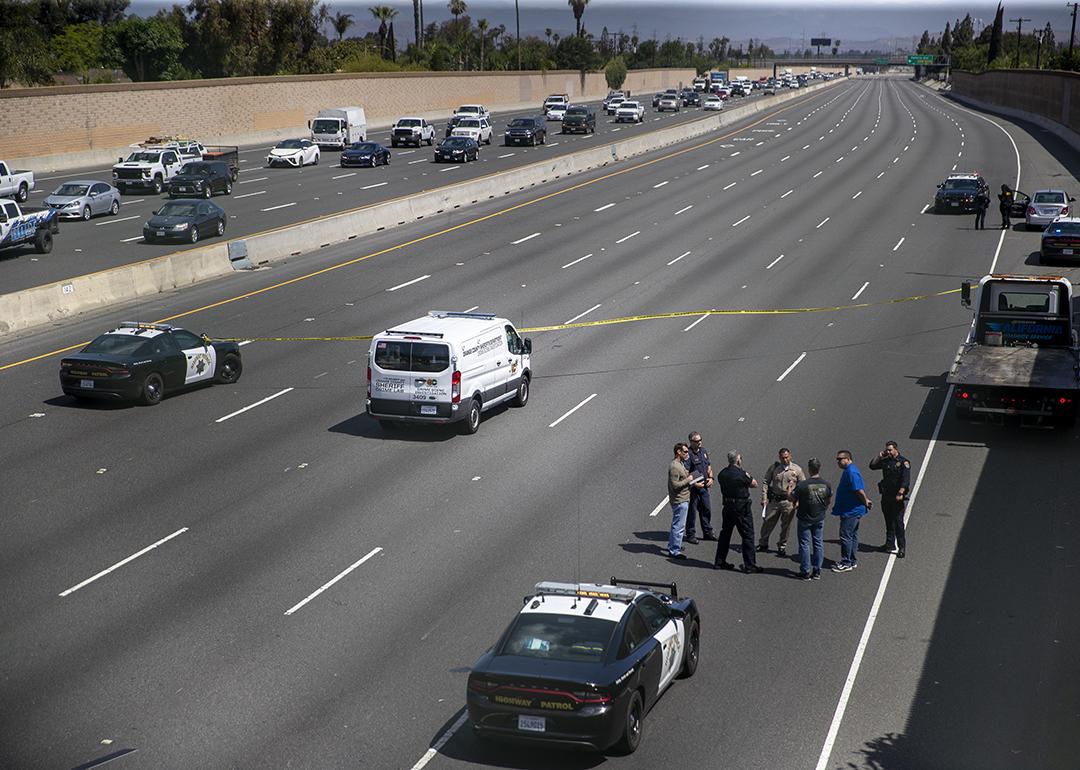
On a crowded highway, the difference between a close call and a catastrophe can be a few seconds of impulse control. Researchers have long examined the . This involves speeding, tailgating, unsafe lane changes, and confrontational gestures. These driving behaviors trigger angry responses and escalate tensions between motorists. One category of these encounters, however, has proven easier to quantify than most: incidents in which road rage involves a firearm.
To better understand where and how road rage is most likely to occur, , a personal injury law firm, examined publicly available transportation and safety data to identify the areas with the highest number of road rage incidents across the United States.
Road rage is common. Measuring it is hard.
Ask drivers if they’ve witnessed aggressive behavior on the road, and most will say yes. In a 2025 AAA Foundation for Traffic Safety report, surveyed reported engaging in aggressive driving or road rage behaviors at least once in the prior year.
But “road rage” is a squishy category. Many confrontations never become police reports, let alone crashes. Even in fatal-crash data, the National Safety Council notes that only incidents involving crashes get counted: just were linked to “road rage” in crash surveillance data.
That data gap is one reason firearm-involved road rage has become a proxy for understanding where driving anger turns especially dangerous: gun incidents are more likely to draw official response and media attention, creating a clearer paper trail than insults, horn-blaring, or intimidation.
Where drivers “lose their cool” most often
Because road rage can look different from one incident to the next, there isn’t a single perfect scoreboard for where it’s “worst.” But gun-involved road rage incidents provide measurable data from .
By total incidents, the most populous states lead
When you simply count the number of gun-involved road rage incidents between 2014 and 2023, the nation’s most populous states rise to the top:
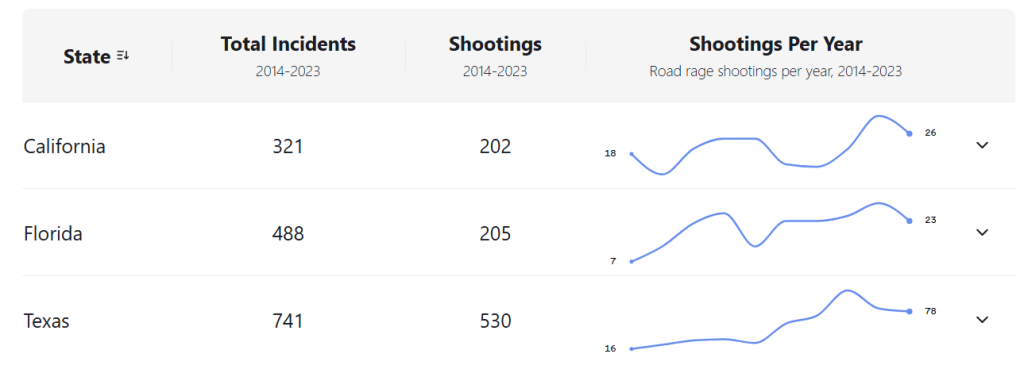
- Texas recorded 741 gun-involved road rage incidents.
- Florida recorded 488 gun-involved road rage incidents.
- California recorded 321 gun-involved road rage incidents.
Other states can jump to the front
To account for population differences, The Trace calculated an average annual rate of armed road rage incidents per 1 million residents. By that measure, New Mexico, Tennessee, and Wisconsin also recorded the highest rates of armed road rage, while New Jersey, New York, and Iowa had the lowest rates.
In other words, the “most incidents” map and the “highest rate” map aren’t the same, and a state can rank high on one and not the other.
Hotspots can be local, not just statewide
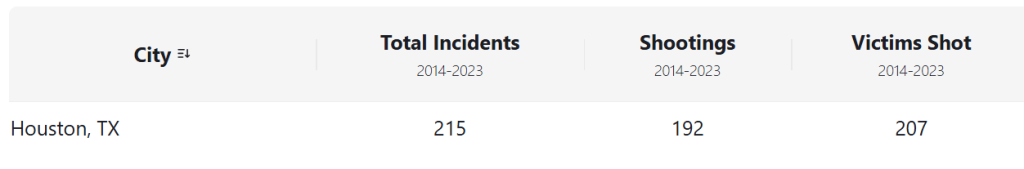
The Trace also identified city-level concentration. Houston had the most gun-involved road rage incidents and shooting victims among cities analyzed: 214 incidents and 206 people killed or wounded from 2014 to 2023.
That kind of clustering is a reminder that “where road rage is worst” may be less about state lines and more about specific metro areas, roadway design, enforcement patterns, and the daily grind of congestion.
What’s fueling the anger
Researchers and safety agencies point to a mix of personal stressors and roadway conditions. emphasizes that aggressive driving and road rage are evolving social behaviors influenced by multiple factors: driving patterns, lifestyle changes, and technology.
There’s also the reality that everyday driving creates ripe conditions for conflict: a blocked goal (getting where you’re going) plus the anonymity of a vehicle can lower inhibitions. The Trace, citing expert research on aggression, notes that frustration can push behavior toward hostility—especially when drivers feel their progress is being impeded.
And then there’s speed. While speeding isn’t the same thing as road rage, it’s one of the clearest measurable signals of high-risk driving. NHTSA reports that and was a contributing factor in 29% of all traffic fatalities that year.
In practice, the same road conditions that increase speeding, congestion, time pressure, and aggressive passing also tend to increase interpersonal conflict.
The road ahead
Road rage stories often arrive as isolated headlines, but the data shows something closer to a pattern, one that varies sharply by state and spikes in specific metro areas.And because so many non-crash incidents go uncounted, the statistics that do exist may reflect only the most visible tip of a broader problem.
For traffic safety officials and policymakers, the question isn’t just where road rage is most common, but how to prevent routine frustration from turning into something far more dangerous. And for drivers, the data underscores a quieter reality of modern roadways: most trips end without incident, but the margin for error in heated encounters has narrowed.
was produced by and reviewed and distributed by ±¬ÁĎTV.


