Air travel looks very different now than it did just a few years ago when the coronavirus pandemic grounded folks around the world, putting a halt to travel for both leisure and business.
In 2020, passenger traffic on U.S. airlines was at its , with just 369 million passengers. In 2021, the U.S. started to get back to more normal air travel levels, and by 2022, the country was up to 853 million airline passengers. By the looks of it, 2023 is likely to outpace those numbers and return to pre-pandemic levels鈥攏early 3 million people flew in and out of U.S. airports daily as of April 2023, according to data from the Federal Aviation Administration's .
When you're at the airport, shuffling around with your roller bag, backpack, neck pillow, and water bottle among the thousands of other passengers doing the same, you're probably not too concerned with more than your flight. Is it on time? Who will be sitting next to you? Did your checked bag make it onto the plane?
But when you're not in flight mode, you may be wondering where all of the other folks at your local airport are traveling to. To answer that question, compiled a list of the most common domestic flights from Chicago Midway International using data from the . Destinations are ranked by total passengers from October 2022 to September 2023.
Read on to find out if your flight patterns are similar to your fellow Chicago Midway International travelers.
You may also like: Highest-paying jobs for people with 2-year degrees in Chicago
lunamarina // Shutterstock
1 / 20#20. Logan International (Boston, MA)
- Passengers: 180,766 (1.8% of all passengers)
- Top carriers:
--- #1. Southwest Airlines: 180,651
--- #2. Delta Air Lines: 115
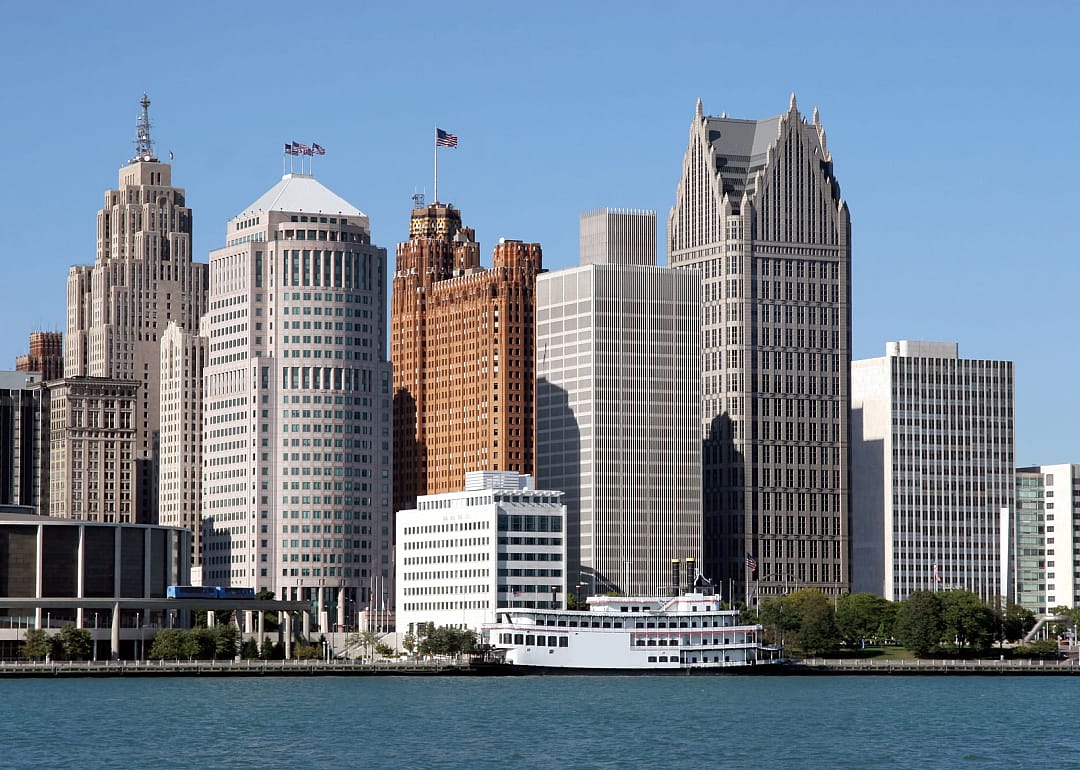
Vladimir Mucibabic // Shutterstock
2 / 20#19. Detroit Metro Wayne County (Detroit, MI)
- Passengers: 193,416 (1.9% of all passengers)
- Top carriers:
--- #1. Southwest Airlines: 142,125
--- #2. SkyWest Airlines: 37,747
--- #3. Endeavor Air: 13,370
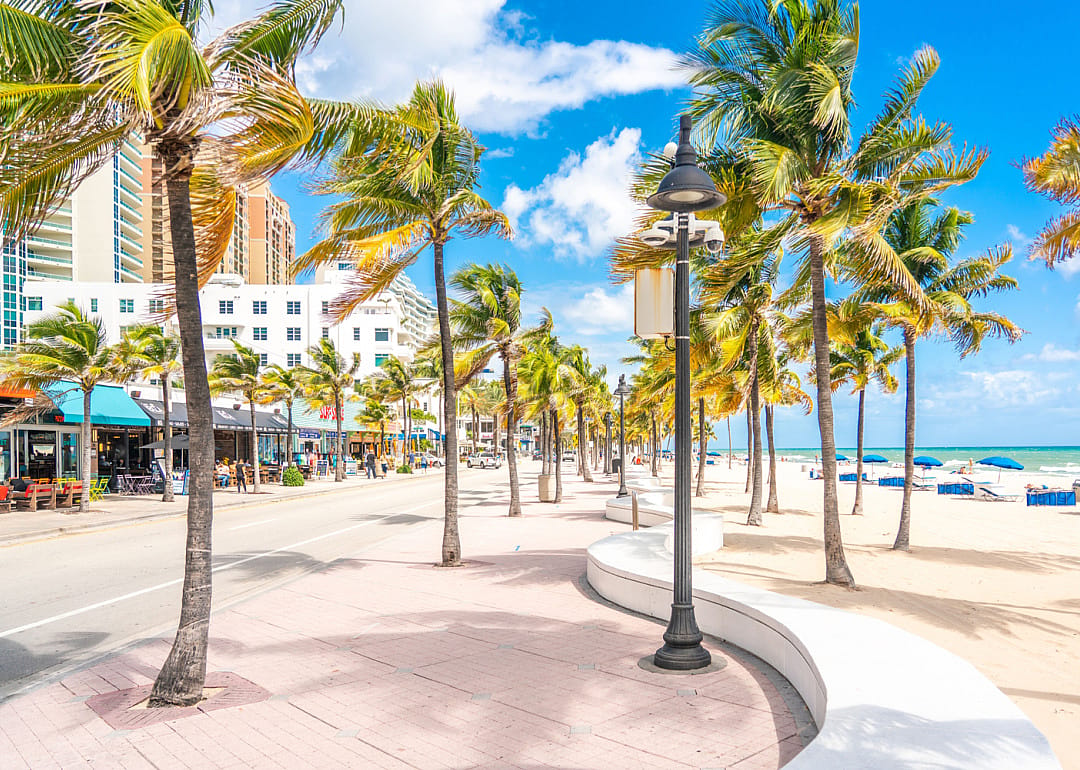
mariakray // Shutterstock
3 / 20#18. Fort Lauderdale-Hollywood International (Fort Lauderdale, FL)
- Passengers: 200,208 (2.0% of all passengers)
- Top carriers:
--- #1. Southwest Airlines: 171,216
--- #2. Frontier Airlines: 28,992
Strike First // Shutterstock
4 / 20#17. Los Angeles International (Los Angeles, CA)
- Passengers: 202,942 (2.0% of all passengers)
- Top carriers:
--- #1. Southwest Airlines: 202,791
f11photo // Shutterstock
5 / 20#16. Baltimore/Washington International Thurgood Marshall (Baltimore, MD)
Orhan Cam // Shutterstock
6 / 20#15. Ronald Reagan Washington National (Washington, DC)
- Passengers: 208,538 (2.0% of all passengers)
- Top carriers:
--- #1. Southwest Airlines: 208,523
Joe Hendrickson // Shutterstock
7 / 20#14. St Louis Lambert International (St. Louis, MO)
- Passengers: 210,733 (2.1% of all passengers)
- Top carriers:
--- #1. Southwest Airlines: 210,447
--- #2. Swift Air, LLC d/b/a Eastern Air Lines d/b/a Eastern: 273
Andrew J Simcox // Shutterstock
8 / 20#13. Philadelphia International (Philadelphia, PA)
- Passengers: 219,517 (2.2% of all passengers)
- Top carriers:
--- #1. Southwest Airlines: 178,369
--- #2. Frontier Airlines: 40,850
--- #3. Delta Air Lines: 225
Brian Wilson Photography // Shutterstock
9 / 20#12. Nashville International (Nashville, TN)
- Passengers: 224,542 (2.2% of all passengers)
- Top carriers:
--- #1. Southwest Airlines: 224,309
--- #2. Swift Air, LLC d/b/a Eastern Air Lines d/b/a Eastern: 112
#11. William P Hobby (Houston, TX)
TommyBrison // Shutterstock
11 / 20#10. Kansas City International (Kansas City, MO)
- Passengers: 253,100 (2.5% of all passengers)
- Top carriers:
--- #1. Southwest Airlines: 253,100
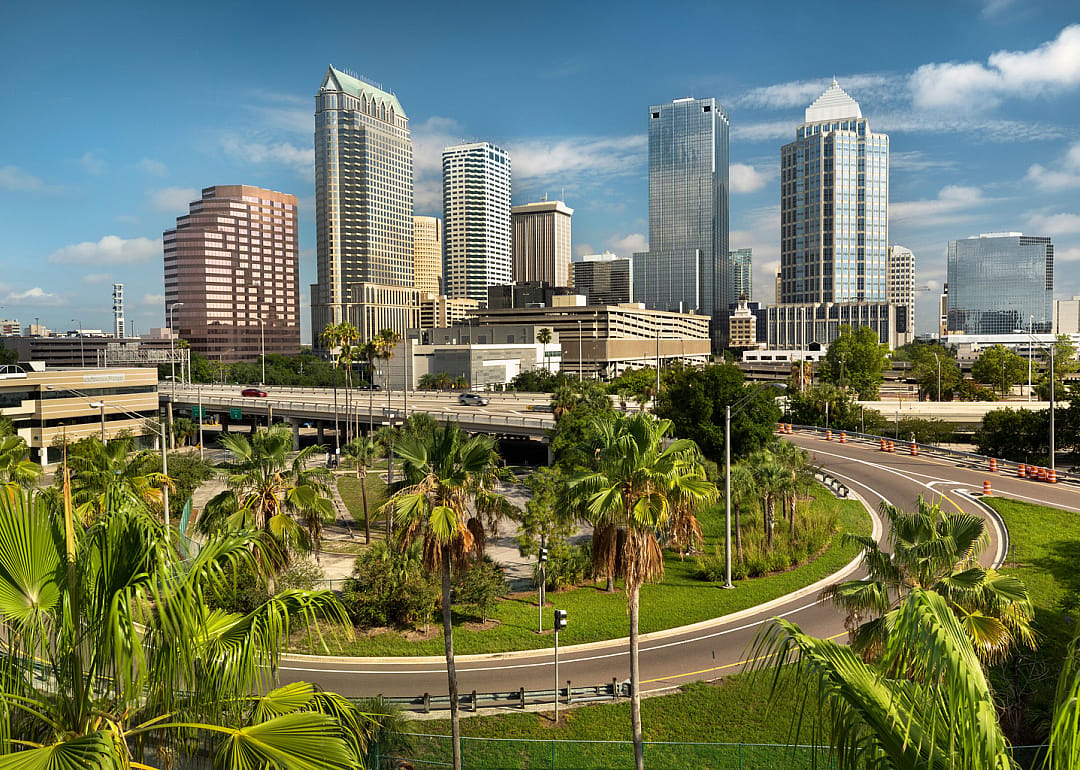
AevanStock // Shutterstock
12 / 20#9. Tampa International (Tampa, FL)
- Passengers: 263,842 (2.6% of all passengers)
- Top carriers:
--- #1. Southwest Airlines: 204,758
--- #2. Frontier Airlines: 59,084
ostreetphotography // Shutterstock
13 / 20#8. Minneapolis-St Paul International (Minneapolis, MN)
- Passengers: 290,296 (2.8% of all passengers)
- Top carriers:
--- #1. Southwest Airlines: 233,572
--- #2. SkyWest Airlines: 39,096
--- #3. Endeavor Air: 14,632
#7. Dallas Love Field (Dallas, TX)
- Passengers: 295,638 (2.9% of all passengers)
- Top carriers:
--- #1. Southwest Airlines: 295,476
Thiago Leite // Shutterstock
15 / 20#6. LaGuardia (New York, NY)
Songquan Deng // Shutterstock
16 / 20#5. Orlando International (Orlando, FL)
- Passengers: 440,959 (4.3% of all passengers)
- Top carriers:
--- #1. Southwest Airlines: 366,071
--- #2. Frontier Airlines: 74,888
Nate Hovee // Shutterstock
17 / 20#4. Phoenix Sky Harbor International (Phoenix, AZ)
- Passengers: 441,050 (4.3% of all passengers)
- Top carriers:
--- #1. Southwest Airlines: 374,953
--- #2. Frontier Airlines: 65,852
--- #3. Delta Air Lines: 192
#3. Hartsfield-Jackson Atlanta International (Atlanta, GA)
- Passengers: 441,818 (4.3% of all passengers)
- Top carriers:
--- #1. Southwest Airlines: 232,234
--- #2. Delta Air Lines: 150,187
--- #3. Frontier Airlines: 59,370
Andrew Zarivny // Shutterstock
19 / 20#2. Denver International (Denver, CO)
- Passengers: 447,017 (4.4% of all passengers)
- Top carriers:
--- #1. Southwest Airlines: 382,751
--- #2. Frontier Airlines: 63,948
--- #3. Delta Air Lines: 267
randy andy // Shutterstock
20 / 20#1. Harry Reid International (Las Vegas, NV)
- Passengers: 455,180 (4.5% of all passengers)
- Top carriers:
--- #1. Southwest Airlines: 391,010
--- #2. Frontier Airlines: 63,933
--- #3. Sun Country Airlines d/b/a MN Airlines: 126
This story features data reporting by Rob Powell, writing by Jaimie Etkin, and is part of a series utilizing data automation across 199 metros.
You may also like: How gas prices have changed in Chicago in the last week