The best and worst cities for home flipping in 2026
The best and worst cities for home flipping in 2026
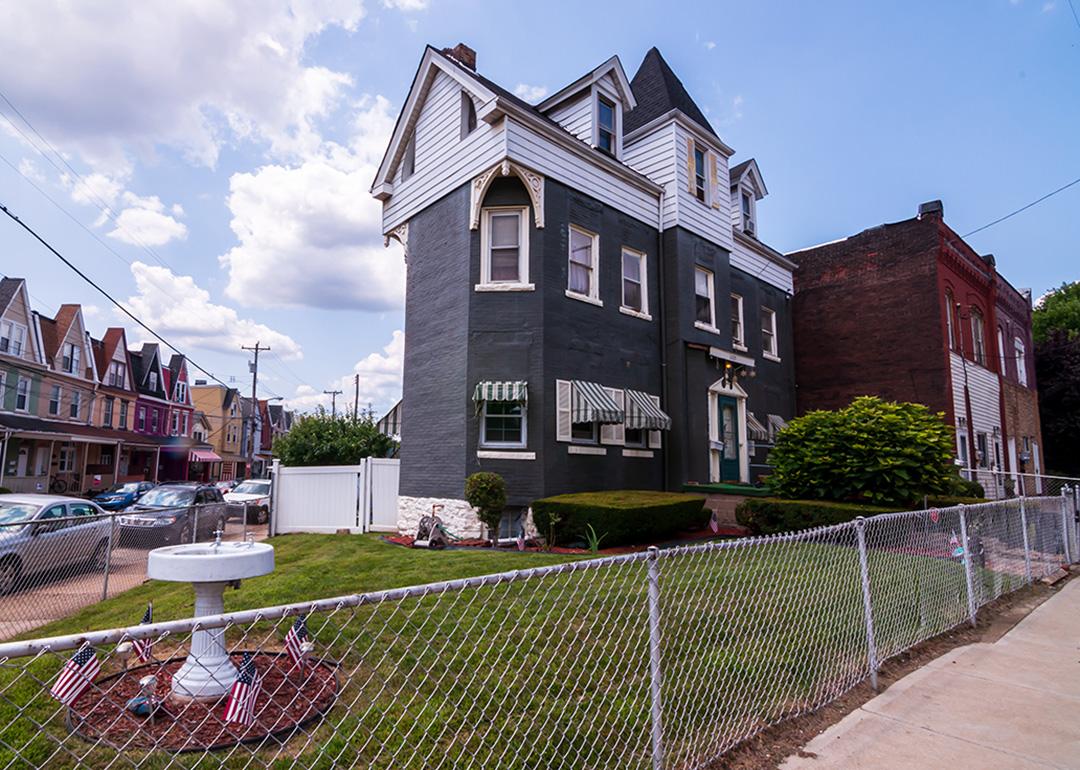
Chances are, you鈥檝e probably seen an HGTV version of home flipping: a crumbling Victorian property being transformed into a modern masterpiece with investors walking away with a six-figure check at the end of the episode. It all sounds great, but in reality, the margins are tighter, interest rates trickier, and the 鈥渆asy money鈥� idea is long gone.
However, there鈥檚 still room for savvy investors. Home flipping hasn鈥檛 exactly disappeared鈥攊t has simply migrated, reports.
As we head into the peak summer flipping season, the divide between sustainable growth markets and equity traps is wider than ever. While some metros are seeing record-breaking ROI, others are seeing investors lose big.
What Makes a Metro Good for Home Flipping?
Before diving into the specific cities, it鈥檚 important to understand what it means to be in a profitable market.
To compare high-growth opportunities and high-risk gambles, specific pillars that define a profitable environment:
- Strong Population Growth: When a city is growing, it means more housing demand. The shows a positive net migration because it creates a floor for demand. And this competition means a higher price and faster resale opportunities, which allow you to move your capital to the next project.
- The 鈥淢iddle-Tier鈥� Market: The best markets aren鈥檛 the ultra-expensive coastal mansions you see where renovation budgets spiral. Nor are they the deeply distressed rural areas. allow flippers to buy entry-level inventory and stay under the local median even after repairs.
- Low Days On Market (DOM): Every extra month a property sits is accumulated interest, taxes, and insurance that eat at your profit. Healthy flipping metros usually show homes selling in about 30-45 days or less.
- Older Housing Stock: We look for cities with homes mostly built before the 1980s. Why? Because those houses have 鈥渃osmetic obsolescence.鈥� And by closing the gap between what a dated house vs. what a modern 鈥淧interest-ready鈥� house is worth, you get buyers willing to pay premiums for move-in-ready homes.
Even in a 鈥減erfect鈥� city, one street can be high-yielding, but the next can be a total deal zone.
6 Metros that Show Promise for Home Flipping
Based on recent data, these markets offer the most favorable balance of entry costs, inventory age, and buyer demand.
1. Pittsburgh, PA
- Approximate Average Home Value: $231, 500
- Annual Appreciation Rate: +2.9% ()
Pittsburgh has one of the highest concentrations of older housing stock in the country, providing a large spread for cosmetic updates that modern buyers are looking for.
2. Rochester, NY
- Approximate Average Home Value: $$225,000 鈥� $240,000
- Annual Appreciation Rate: (Q1 2026 YoY)
Rochester has recently ranked among the for profits in the Northeast/Midwest due to persistent inventory shortages.
3. Buffalo, NY
- Approximate Average Home Value: $277,500
- Annual Appreciation Rate: +3.65% (forecasted to remain steady)
in this metro sold above asking price in the last year, so there鈥檚 a deep pool of eager buyers waiting for renovated inventory.
4. Hartford, CT
- Approximate Average Home Value: $381,760
- Annual Appreciation Rate: +4.3%
Hartford was also voted one of the "Hottest Markets" for 2026. With 63% fewer homes for sale than pre-pandemic levels, competition is fierce. Well-renovated homes sell almost immediately.
5. Philadelphia, PA
- Approximate Average Home Value: $378,000
- Annual Appreciation Rate: +3.0%
Philly offers a unique 鈥渉yper-local鈥� opportunity. While this city is stable, specific ZIP codes are seeing rapid revitalization, allowing for targeted high-yield flips.
6. Dallas, TX
- Approximate Average Home Value: $311,957
- Annual Appreciation Rate: +2.4%
While other cities like Austin are correcting, Dallas remains a top destination for many relocators. The spread is found in the older 1950s-70s neighborhoods where young families are yearning for renovated, ready-to-move-in homes.
6 Metros Where Home Flipping Is Risky
The following cities, on the other hand, face a triple threat: high entry costs, rising carrying burdens, and a selective buyer pool.
1. San Jose, CA
- Approximate Average Home Value: $2,030,000
- Annual Appreciation Rate: +0.5% (stagnating)
High interest rates have made on these prices nearly impossible for average buyers. It鈥檚 a locked market with very few transactions.
2. Austin, TX
- Approximate Average Home Value: $500,600
- Annual Appreciation Rate: -5.9% (one of the steepest declines in 2026)
After years of hyper-growth, Austin is currently facing an oversupply of inventory. Your flipped home might sit on the market for months, losing value.
3. Miami, FL
- Approximate Average Home Value: $550,000 鈥� $600,000
- Annual Appreciation Rate: -2.3% (South Florida average pullback)
Sky-high insurance premiums and property taxes are the silent killer here, often eating 20-30% of your projected profit while you wait for permits or construction.
4. Phoenix, AZ
- Approximate Average Home Value: $450,000 鈥� $480,000
- Annual Appreciation Rate: +0.2% (Near-flat growth)
With more home flippers competing for the same inventory, the 鈥渁s-is鈥� purchase prices have been bid up to leave room for meaningful profit.
5. San Francisco, CA
- Approximate Average Home Value: $1,350,000
- Annual Appreciation Rate: -2.9% ()
Declining sales volume with high regulatory friction means that a successful flop can be wiped out by unexpected delays or a sudden dip in buyer confidence.
6. Las Vegas, NV
- Approximate Average Home Value: $480,000
- Annual Appreciation Rate: -1.0% (Slight pullback from late 2025 highs)
Homes are sitting significantly longer, averaging up to 60 days . With high inventory, two months of holding plus a potential price cut can quickly turn your profit into a break-even scenario.
An Important Reality: Timing is Everything
The truth is, any metro can change from a high-yield corridor to a low-margin trap within a single year. If a neighborhood gets flooded with home flippers, profit margins shrink as everyone competes for the same limited pool of buyers.
Experienced investors know that success isn鈥檛 only about the city鈥攊t comes down to the hyper-local data. To find real success, you have to identify specific ZIP codes, streets, or school districts before hitting the mainstream.
This is where an intensive becomes your best asset. By investigating local ownership history and neighborhood-level momentum, you can find the off-market opportunities that deliver the highest ROI. You get the below true market value and move on to your next flip.
Final Thoughts
While national headlines might suggest volatility for home flipping, the data shows that in certain metros, like Pittsburgh and Buffalo, the opportunity for a profitable renovation is very much alive and kicking.
In this new cycle, investors who win are the ones who do the most homework before the first day of demolition. Just remember that in this market, the profit is realized when you buy, not just when you sell.
was produced by and reviewed and distributed by 爆料TV.