Cities with the most expensive homes in the Longview, Texas metro area
Purchasing a home is one of the most important investments there is. More than a place to live, homeownership is an asset with the potential to tremendously rise in value. But with home prices reaching record heights, plays a huge role for buyers.
The typical home value in the United States was $372,057 in June, 1.1% higher than the year before.
High mortgage rates are also making monthly payments more expensive; as of July 16, the sits at 6.55%.Although home prices have inflated all across the U.S., there are some cities that command a higher price tag than others. Location, size, age, and condition are all contributing factors to home value.
compiled a list of cities with the most expensive homes in the Longview, Texas metro area using data from . Charts show the monthly typical home value since January 2018. All 21 cities and towns with data available were included in the list.
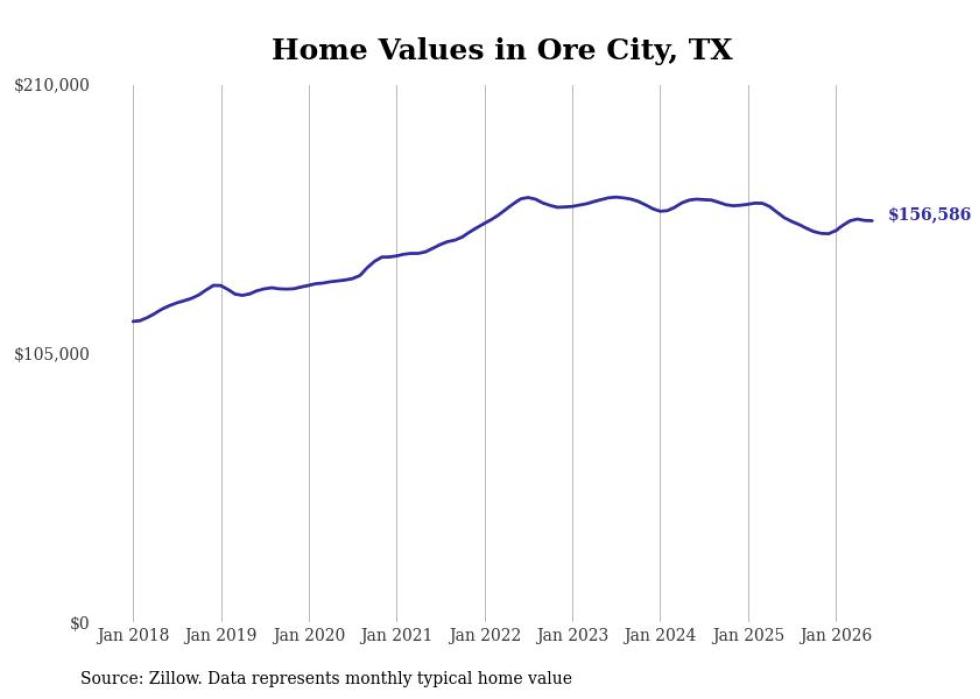
#21. Ore City, TX
- Typical home value: $156,586
- 1-year price change: -0.8%
- 5-year price change: +7.4%
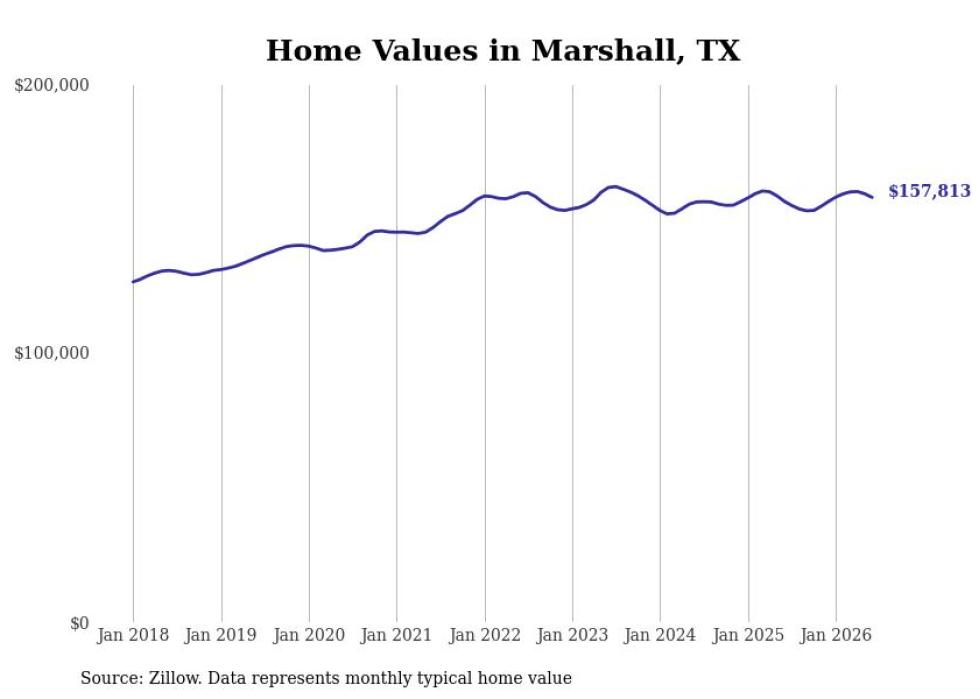
#20. Marshall, TX
- Typical home value: $157,813
- 1-year price change: +0.9%
- 5-year price change: +7.7%
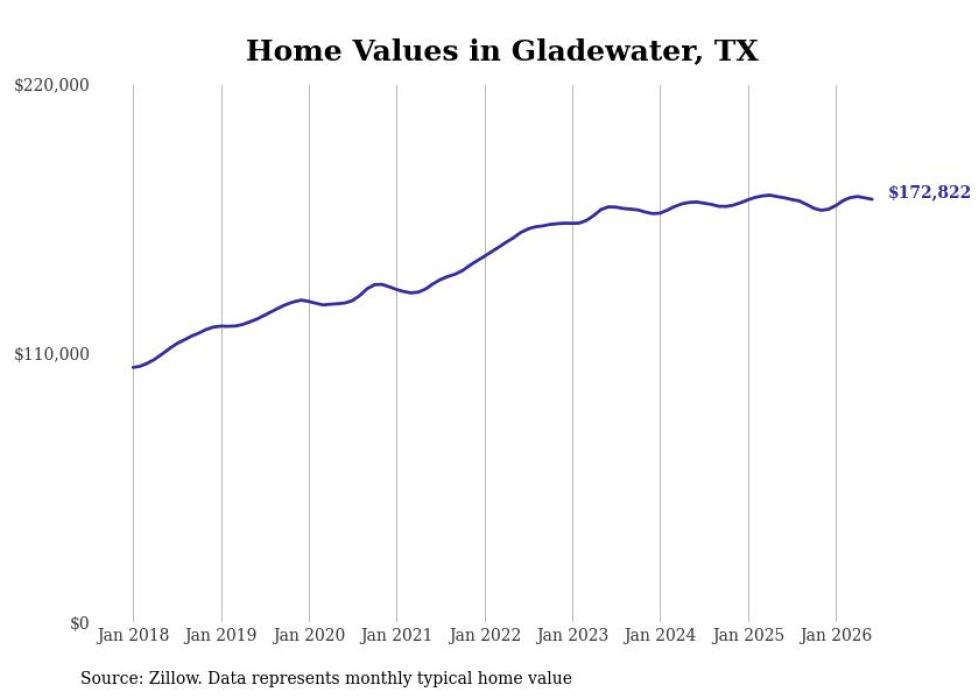
#19. Gladewater, TX
- Typical home value: $172,822
- 1-year price change: -0.4%
- 5-year price change: +25.0%
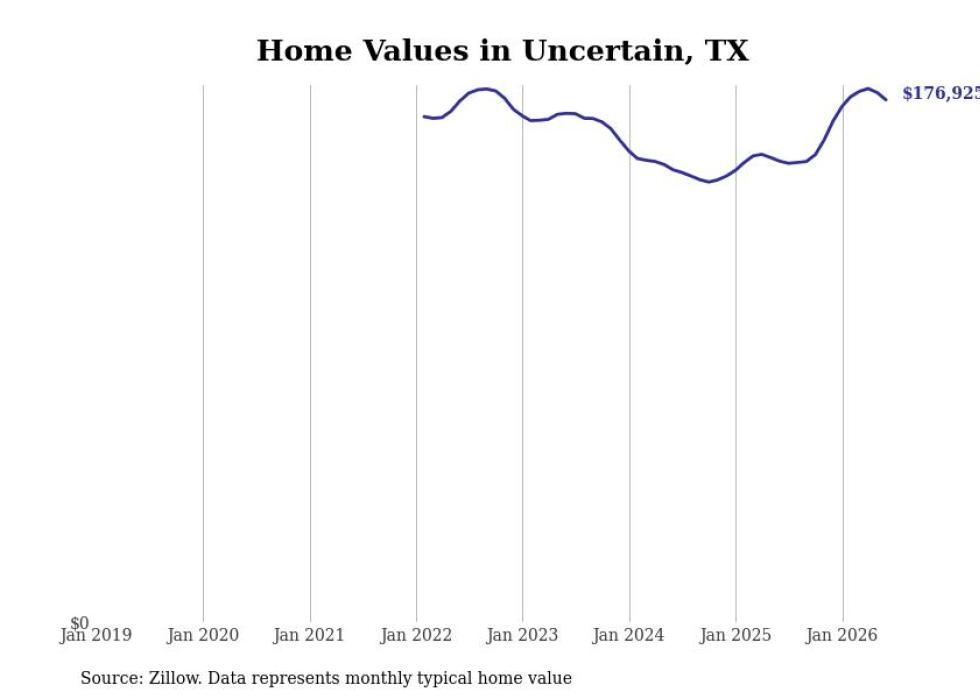
#18. Uncertain, TX
- Typical home value: $176,925
- 1-year price change: +13.3%
- 5-year price change: data not available
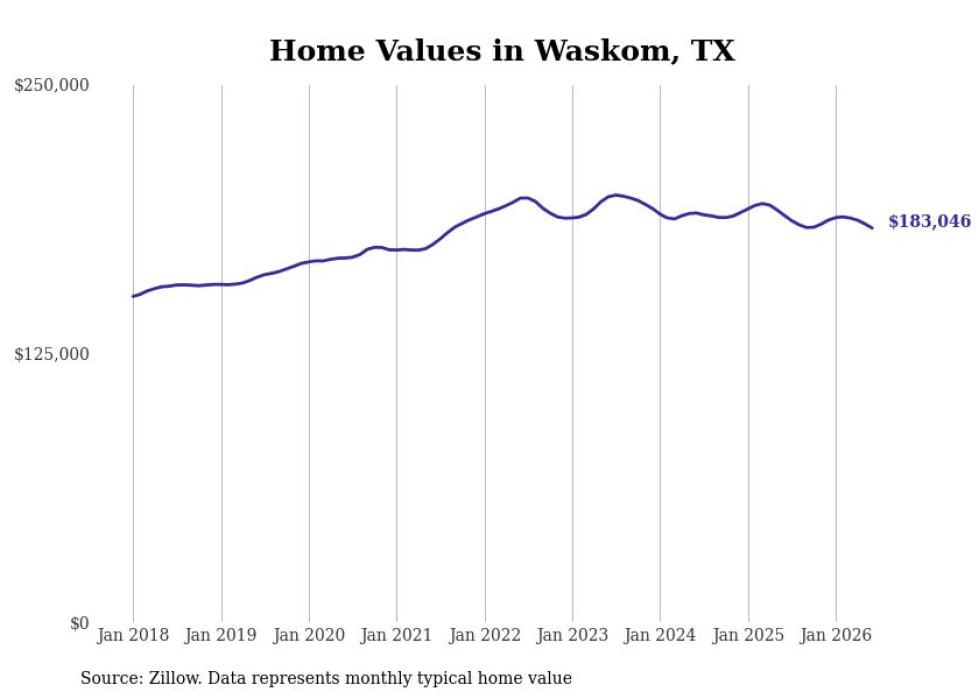
#17. Waskom, TX
- Typical home value: $183,046
- 1-year price change: -3.1%
- 5-year price change: +4.3%
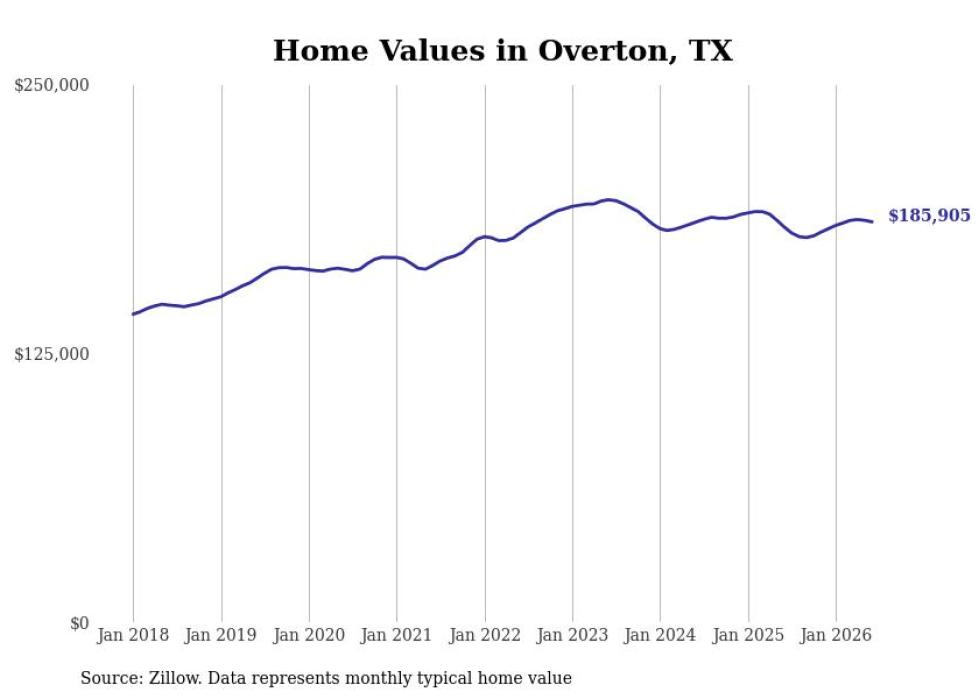
#16. Overton, TX
- Typical home value: $185,905
- 1-year price change: +1.3%
- 5-year price change: +12.2%
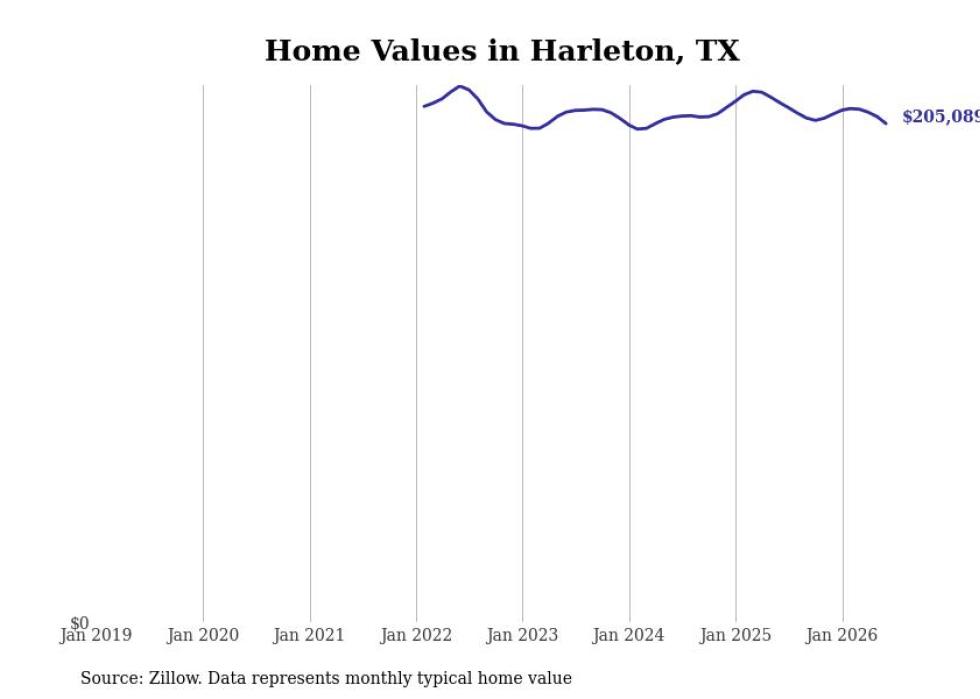
#15. Harleton, TX
- Typical home value: $205,089
- 1-year price change: -4.1%
- 5-year price change: data not available
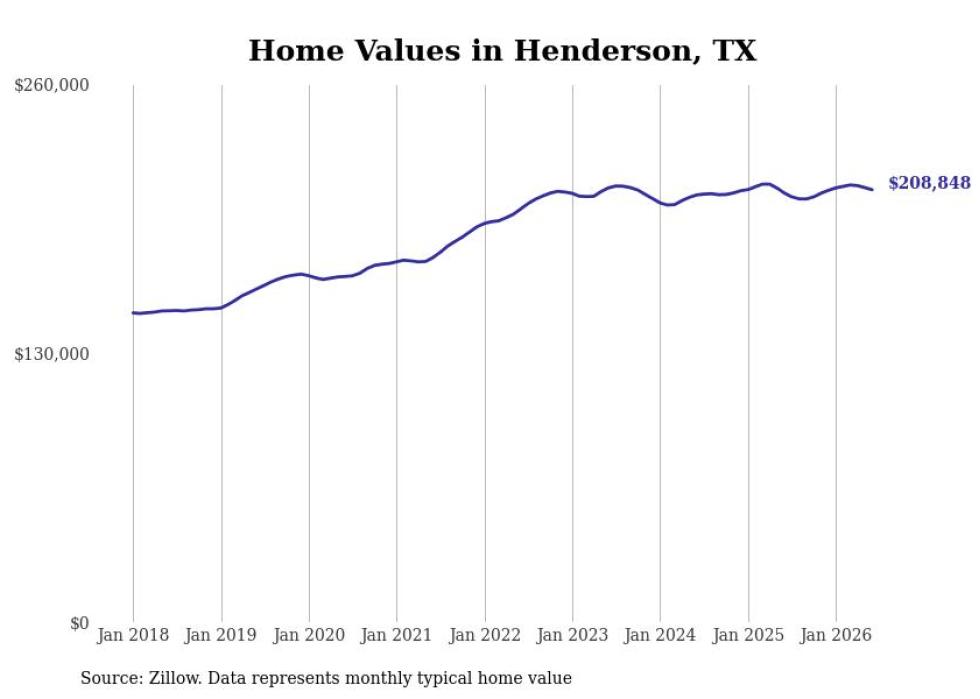
#14. Henderson, TX
- Typical home value: $208,848
- 1-year price change: +0.8%
- 5-year price change: +18.6%
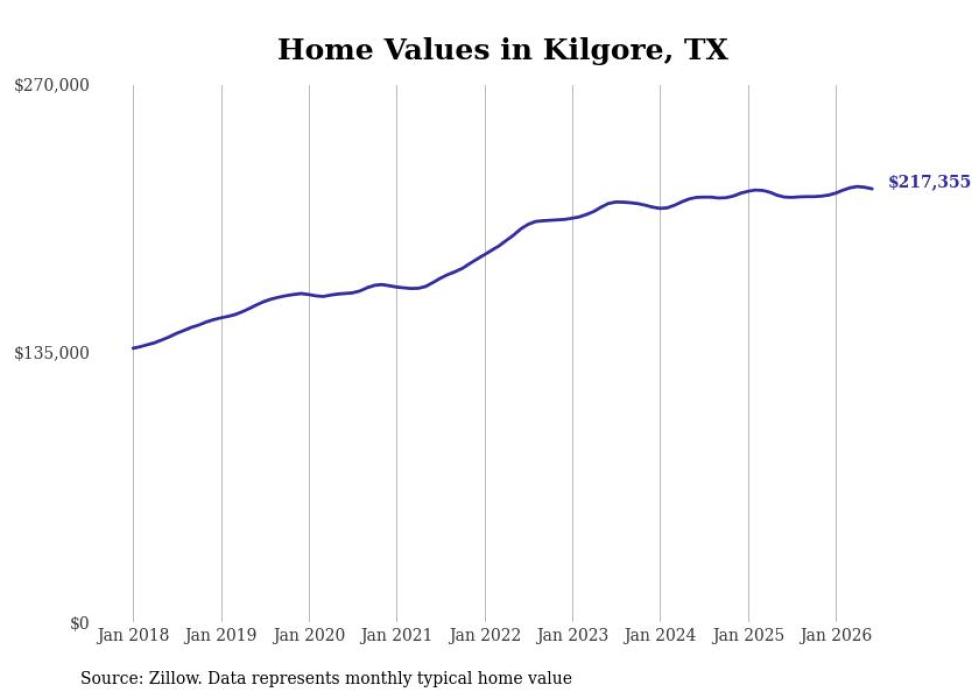
#13. Kilgore, TX
- Typical home value: $217,355
- 1-year price change: +1.9%
- 5-year price change: +27.6%
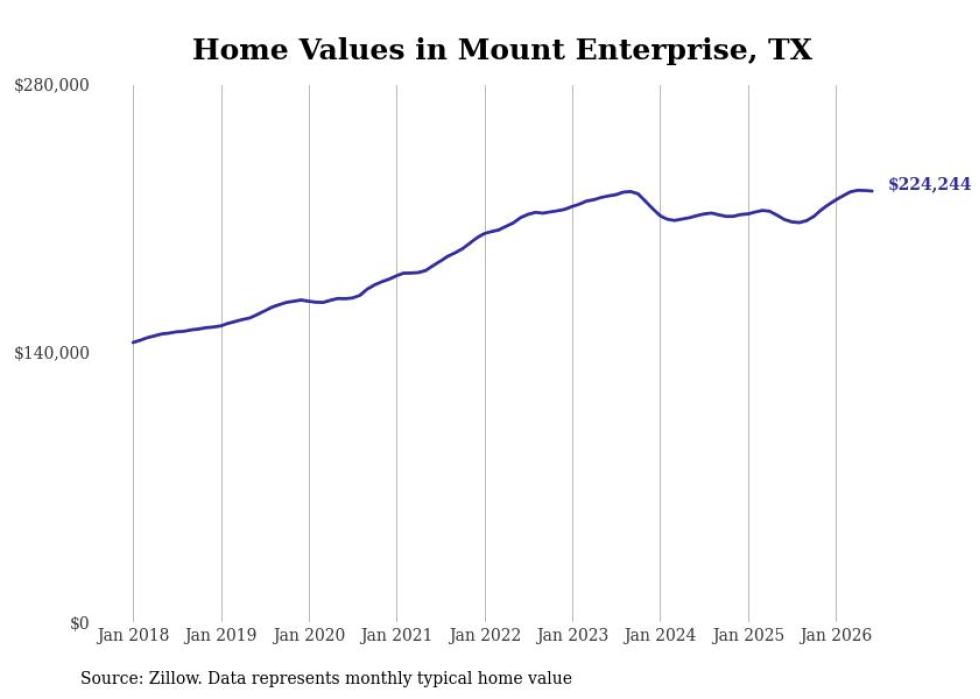
#12. Mount Enterprise, TX
- Typical home value: $224,244
- 1-year price change: +7.1%
- 5-year price change: +21.0%
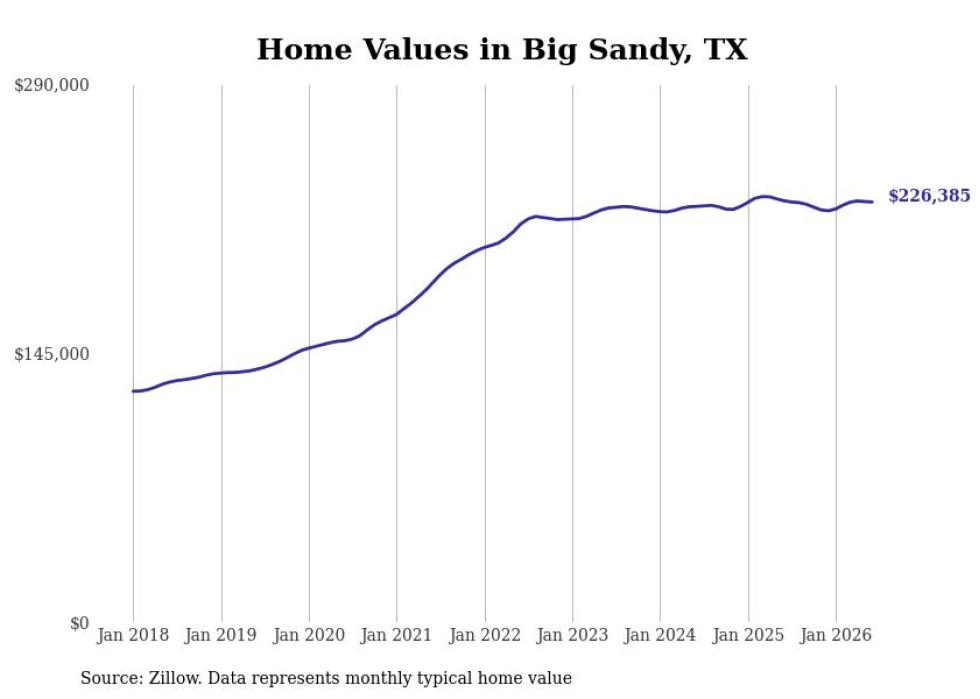
#11. Big Sandy, TX
- Typical home value: $226,385
- 1-year price change: -0.3%
- 5-year price change: +23.8%
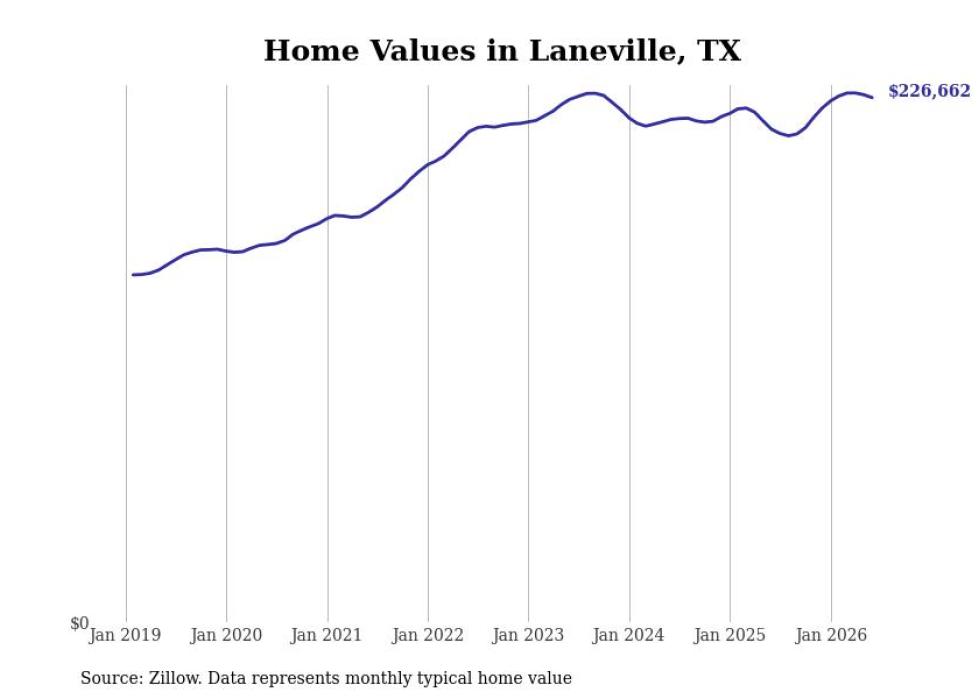
#10. Laneville, TX
- Typical home value: $226,662
- 1-year price change: +6.4%
- 5-year price change: +28.0%
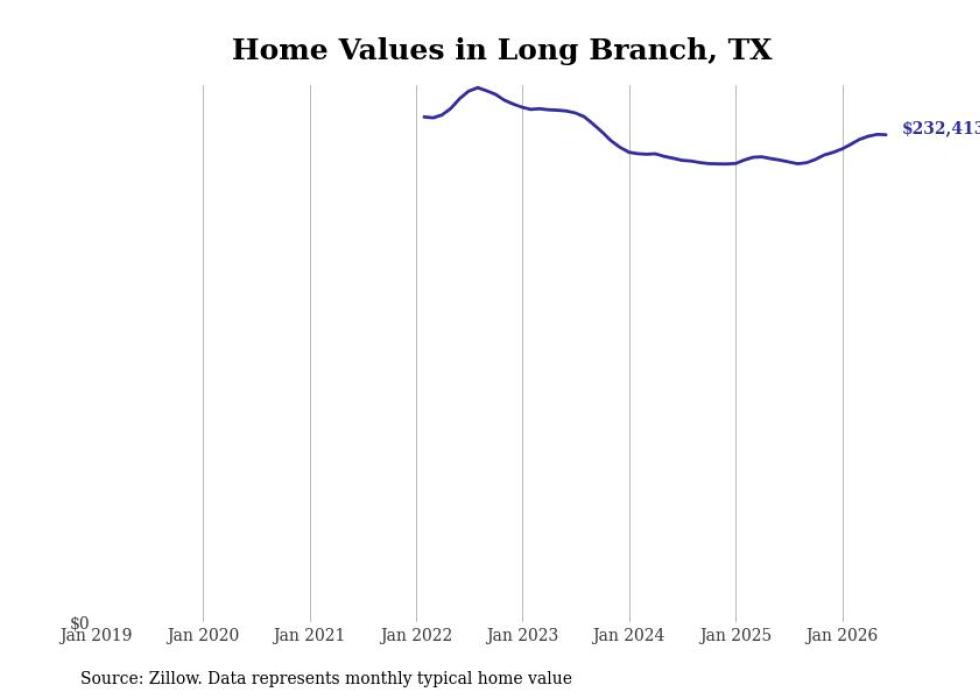
#9. Long Branch, TX
- Typical home value: $232,413
- 1-year price change: +5.5%
- 5-year price change: data not available
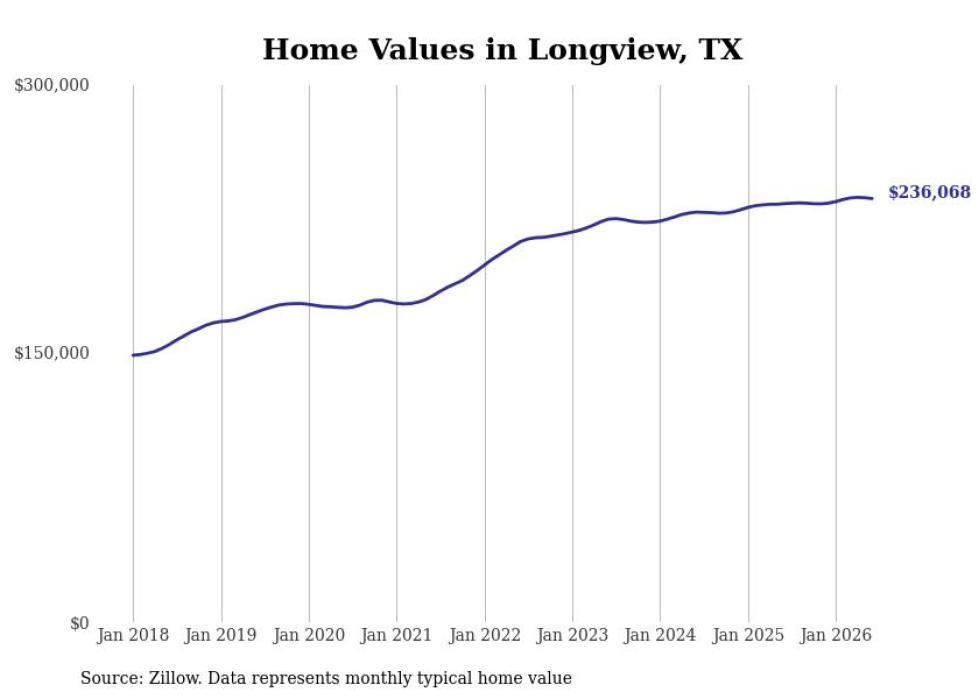
#8. Longview, TX
- Typical home value: $236,068
- 1-year price change: +1.2%
- 5-year price change: +29.8%
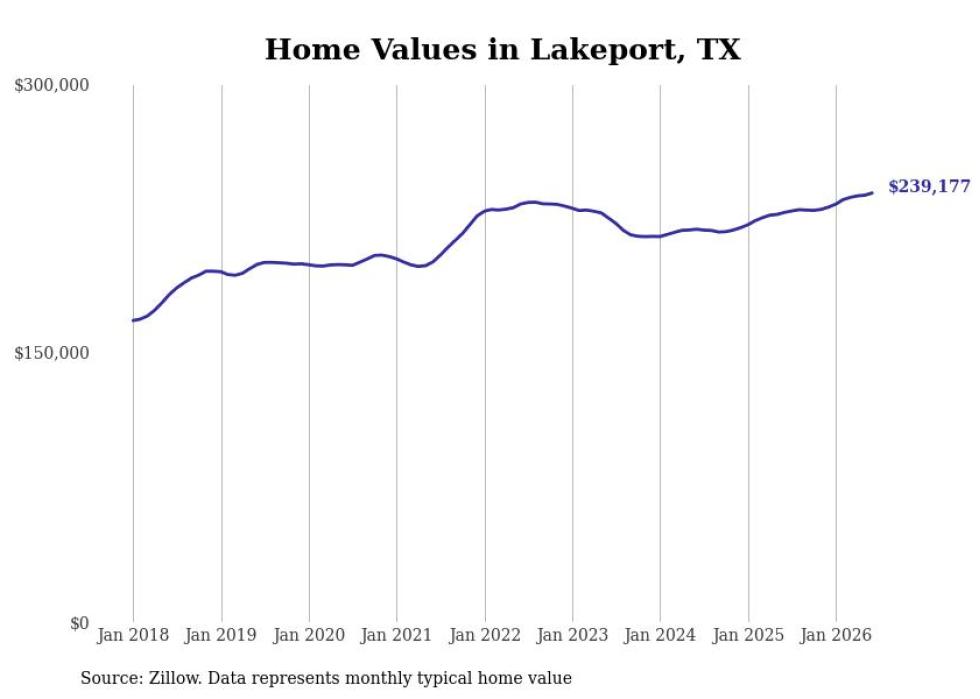
#7. Lakeport, TX
- Typical home value: $239,177
- 1-year price change: +4.7%
- 5-year price change: +19.2%
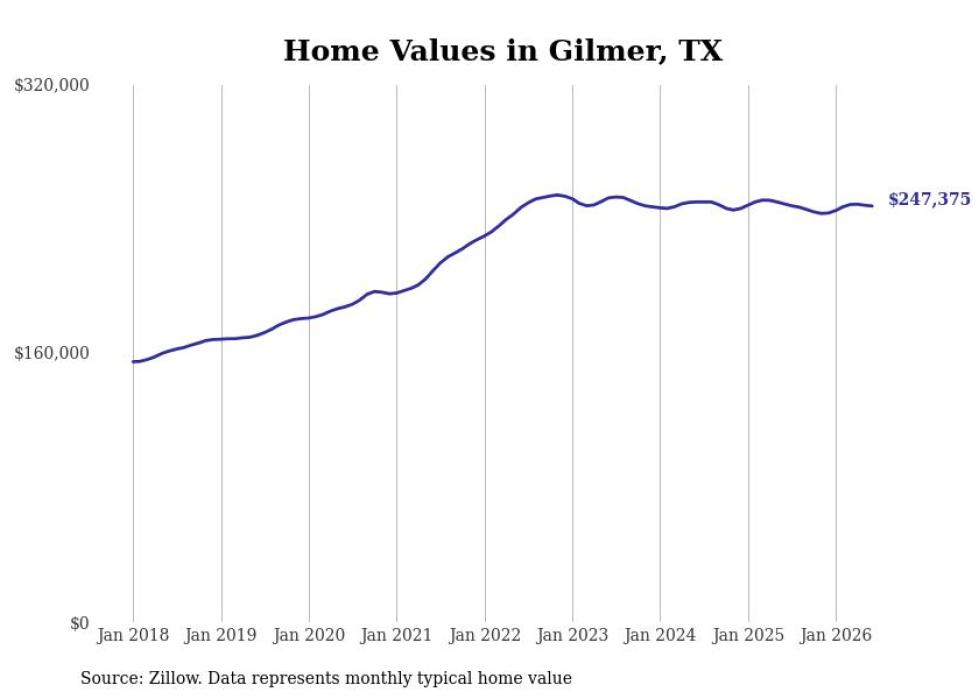
#6. Gilmer, TX
- Typical home value: $247,375
- 1-year price change: -0.5%
- 5-year price change: +18.4%
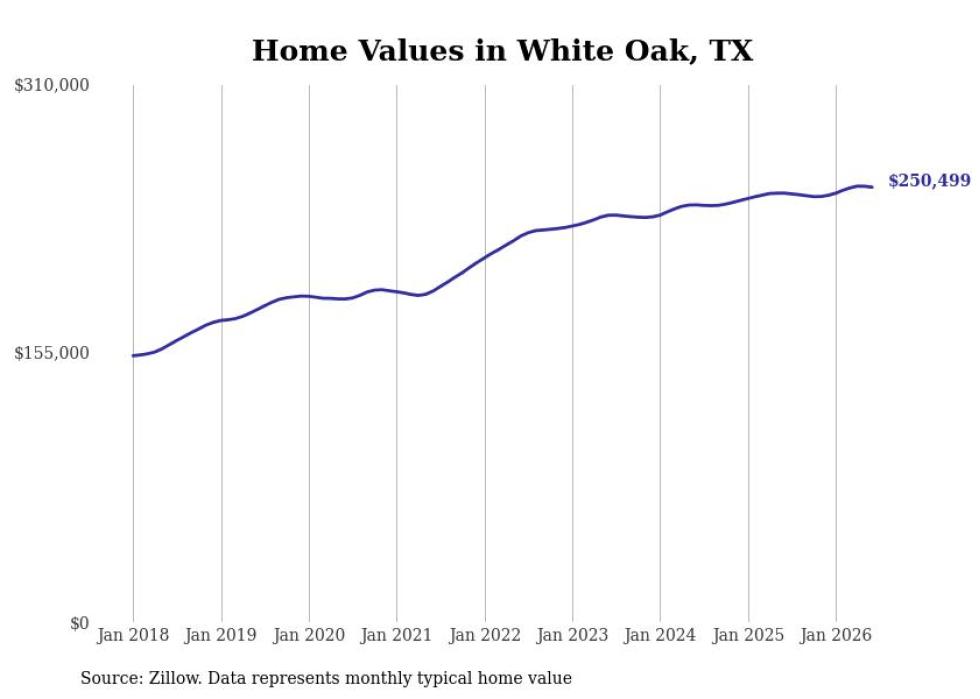
#5. White Oak, TX
- Typical home value: $250,499
- 1-year price change: +1.4%
- 5-year price change: +31.4%
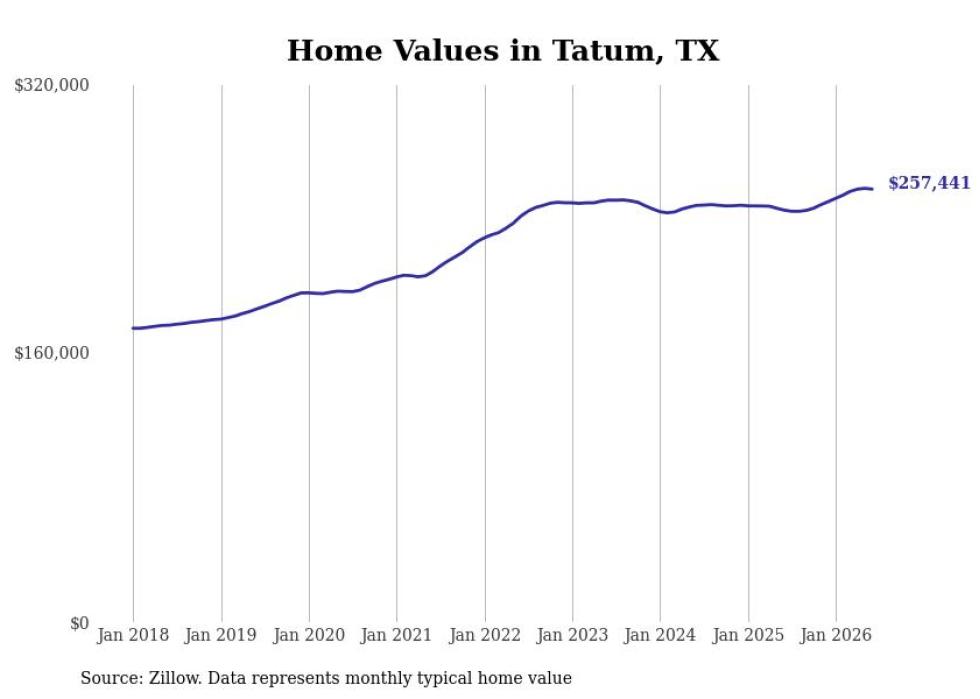
#4. Tatum, TX
- Typical home value: $257,441
- 1-year price change: +5.1%
- 5-year price change: +23.5%
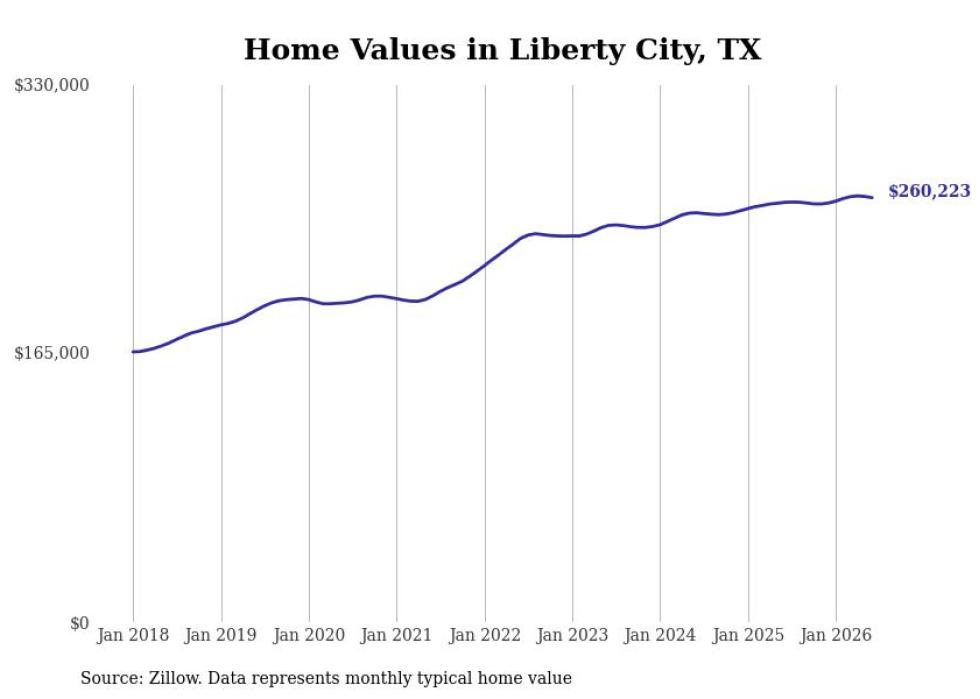
#3. Liberty City, TX
- Typical home value: $260,223
- 1-year price change: +1.1%
- 5-year price change: +30.1%
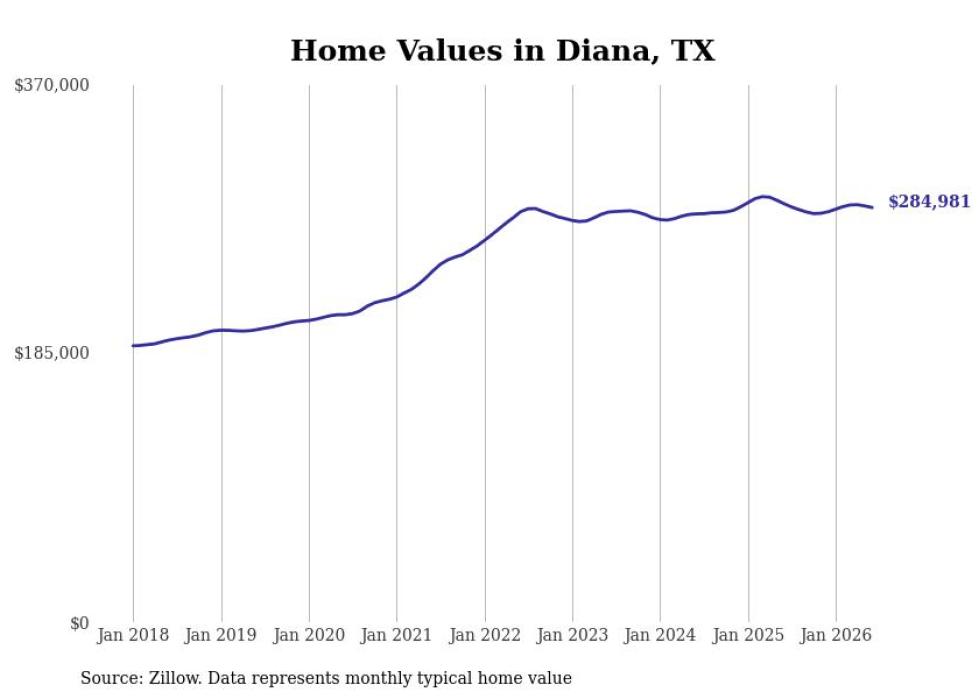
#2. Diana, TX
- Typical home value: $284,981
- 1-year price change: -0.9%
- 5-year price change: +18.1%
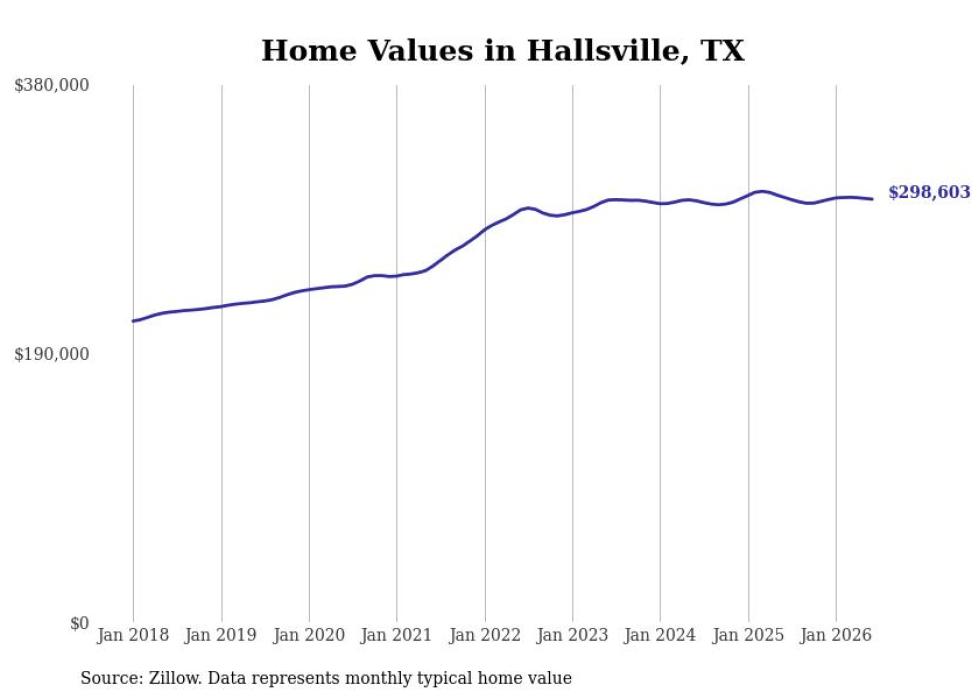
#1. Hallsville, TX
- Typical home value: $298,603
- 1-year price change: -0.4%
- 5-year price change: +18.8%